

The situation
The time between a failure and the moment the service desk knows about it is downtime that nobody is working on.
An ERP front end used by finance, sales and the warehouse fails mid-morning. Three organisations run GLPI, and each finds out differently:
- No monitoring: people notice and email the service desk.
- Zabbix on premises, with its GLPI webhook switched on.
- Google Cloud, where Cloud Monitoring watches the ERP.
We ran the same failure for each of the three in its own real-time run and timed each step until the service desk knew.
First sign of trouble: the first user email, 2 min 50 s after the failure. It became a ticket 11 min 18 s after the failure.
Source: MarifeX reproduction of the scenario on standard GLPI.
The challenge
Detection speed is only part of the problem. What reaches GLPI must also be a record the service desk can act on.
- 01
A late signal
Without monitoring, detection depends on user reports, and GLPI sees them only when its scheduled tasks run.
- 02
A silent alert
An alert that fires but reaches nobody is worse than none, because everyone assumes it works.
- 03
Ticket noise
A service that fails, recovers and fails again can open a new ticket every time.
- 04
Records that close themselves
A ticket solved by a recovery signal says the check passed, not that users can work.
Speed only helps if what reaches GLPI is one record the service desk can own.
How each organisation finds out
Times are counted from the moment the ERP failed.
No monitoring Detection depends on user reports
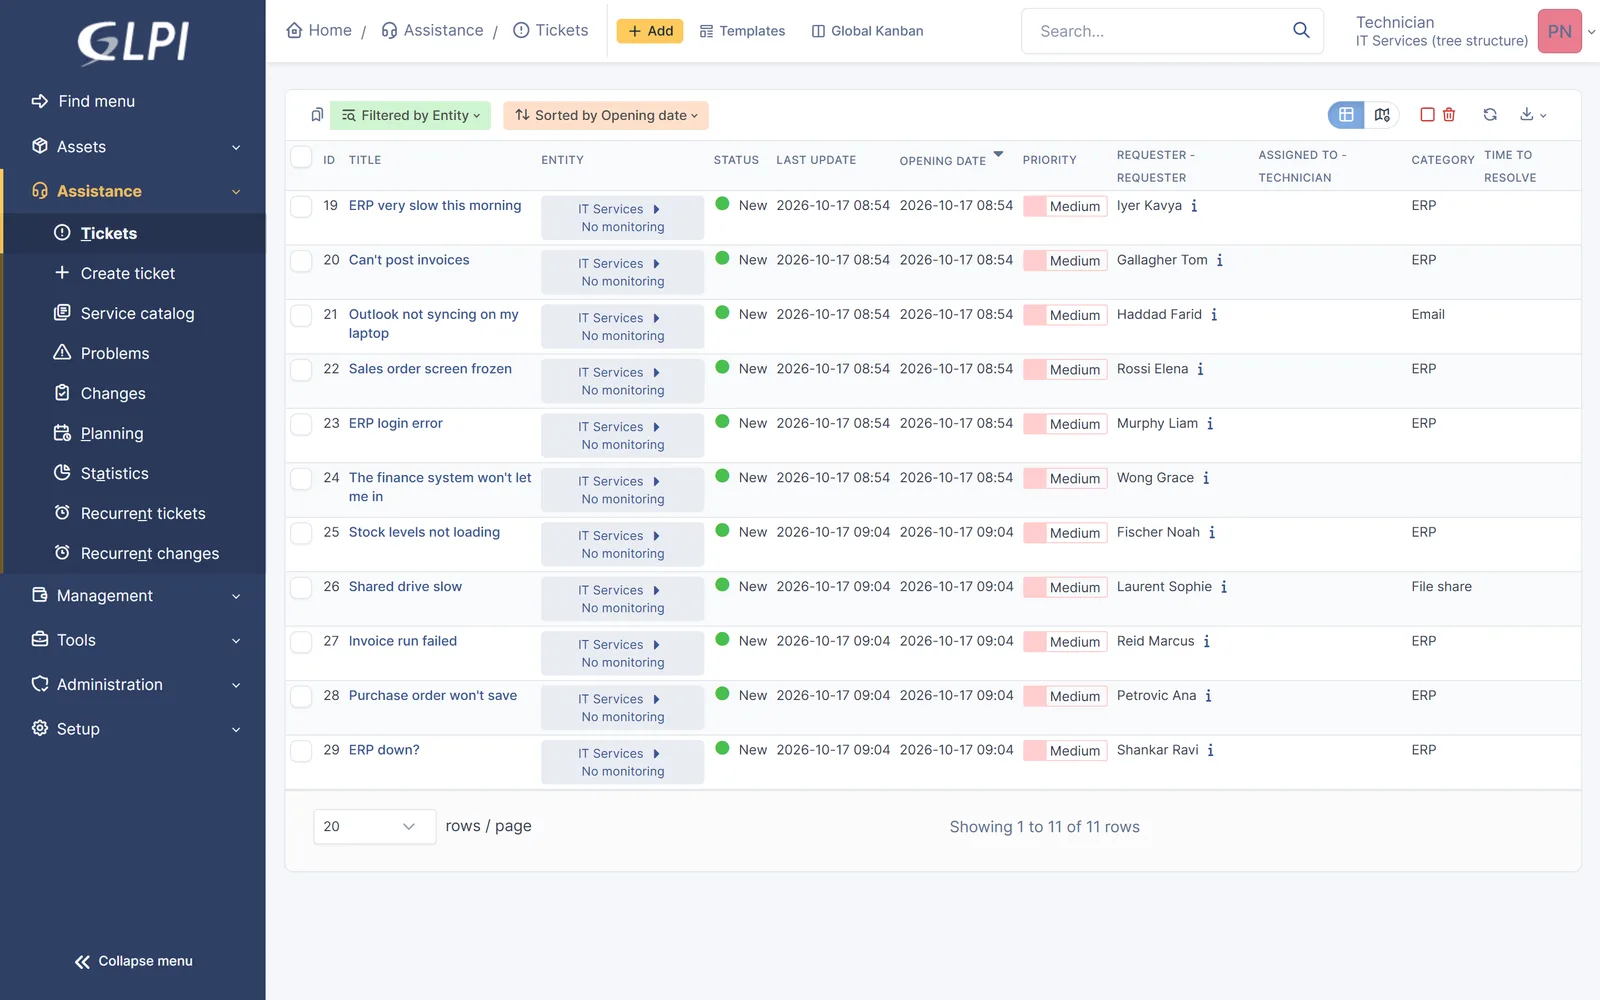
The first user email arrived 2 minutes 50 seconds after the failure. Eleven reports followed over the next 17 minutes, nine of them about the ERP.
The mail collector converts the emails into tickets, and routing rules set the category from keywords in the message. The collector runs every ten minutes by default, so the reports reached GLPI in two batches, 11 and 20 minutes after the failure.
A saved search counts open ERP tickets from the last 15 minutes and alerts the service lead at five or more. That check also runs on a schedule. The lead was alerted after 22 minutes 37 seconds.
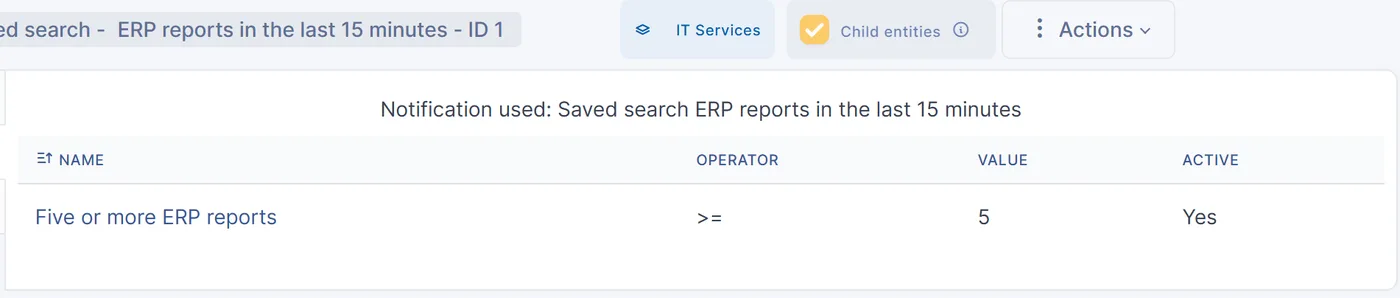
Two configuration gaps affected the result. One ERP report used none of the keywords in the routing rule, so it was not categorised and did not count towards the alert. On the first attempt the alert fired but nobody received it: for a shared saved search, GLPI sends the alert only once a notification exists for that search, and the button that creates it leaves it inactive.
Zabbix The alert is the first report
Zabbix checks the ERP every 30 seconds and raises a problem after two failed checks. Its GLPI webhook opens a ticket through the GLPI API. The ticket was in GLPI after 1 minute 2 seconds, almost two minutes before the first user email.
When the ERP came back eight minutes later, the webhook solved the ticket within 27 seconds and renamed it “Resolved in 7m 25s: ERP web service is down”. Nobody at the service desk had touched it. Two more short failures, a little over a minute each, opened two more tickets, each solved automatically when the check passed.
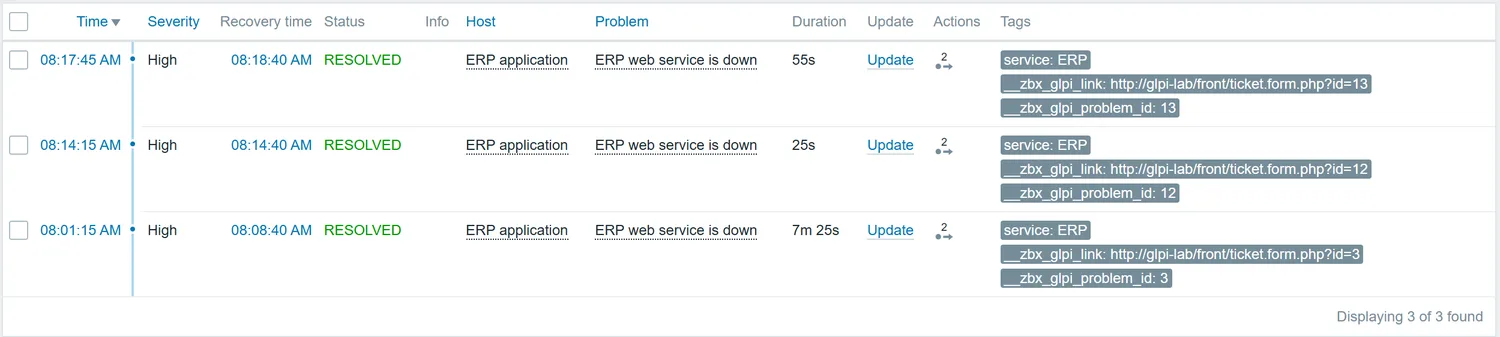
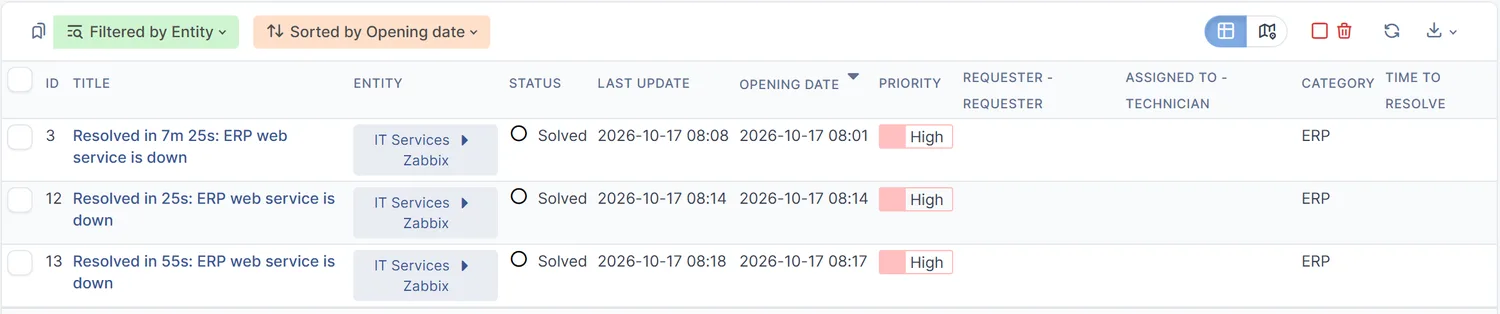
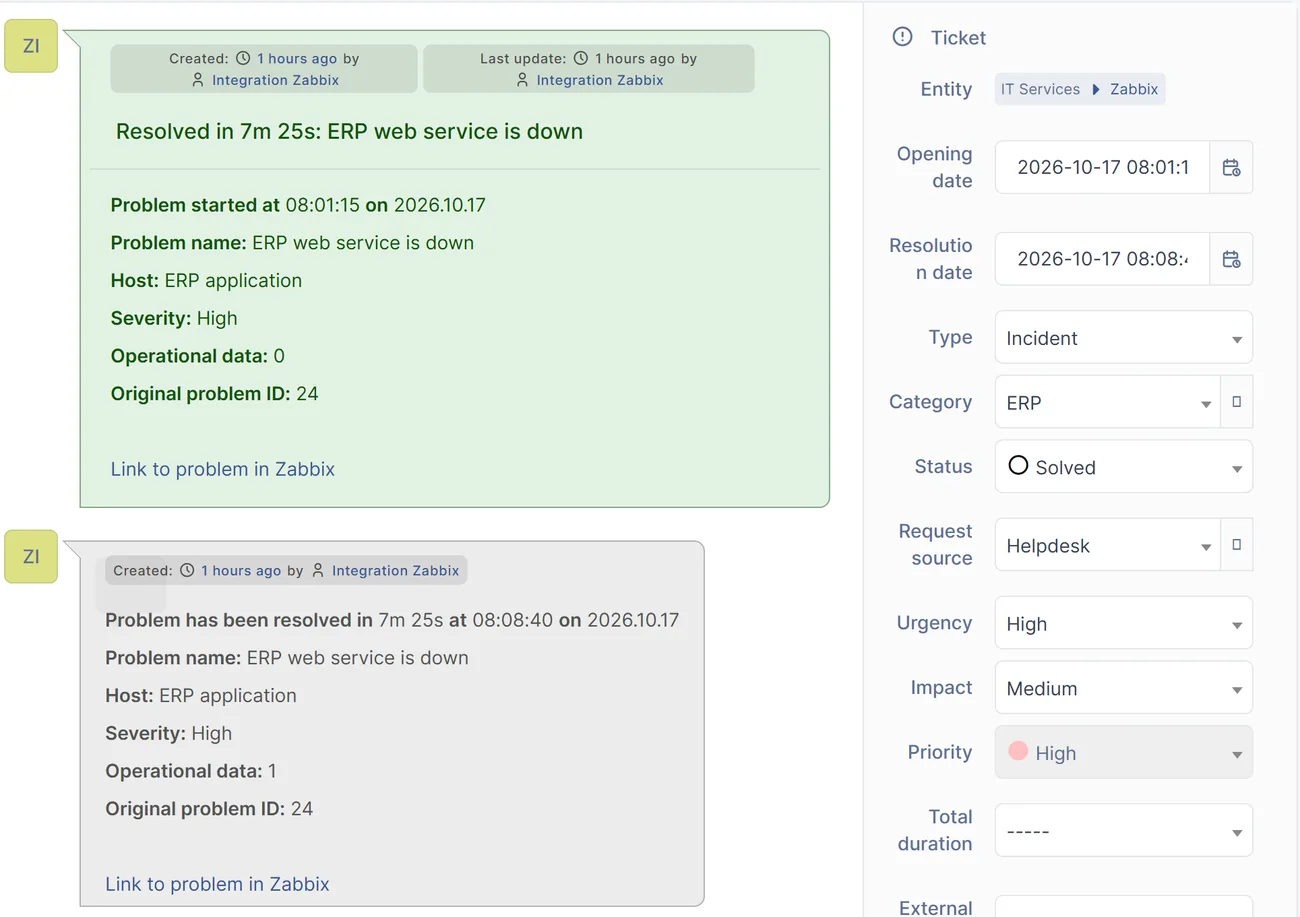
The webhook works as written: one ticket per Zabbix event, solved on recovery. For the service desk that means three records for one service, no link to the ERP service record, and tickets closed before anyone at the service desk reviewed them. A GLPI ticket rule can add the service link; we did not set one up for this run.
Google Cloud Alerts reach GLPI on the internal network
Here the ERP front end runs on Cloud Run. Cloud Monitoring checks it every minute from three regions using authenticated requests, so the ERP does not need to accept anonymous traffic. The alert fires when more than one region fails for a minute.

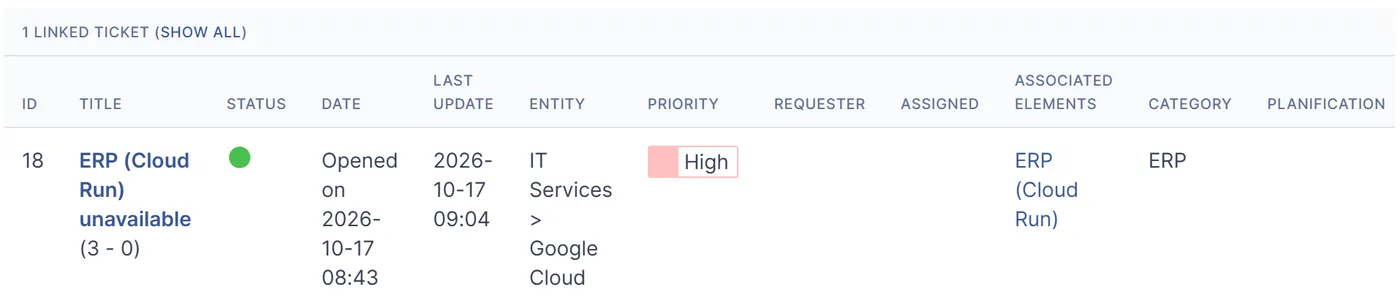
The alert goes to Pub/Sub, which passes it to a small function that only accepts Google-signed requests. The function reaches GLPI over the internal network, so GLPI is not exposed either. The ticket was in GLPI after 3 minutes 38 seconds, linked to the “ERP (Cloud Run)” service record.
Cloud Run can also be set to internal-only access, which Google documents as still accepting uptime checks and Pub/Sub from the same project. That would take both services off the internet; we did not test that setup.
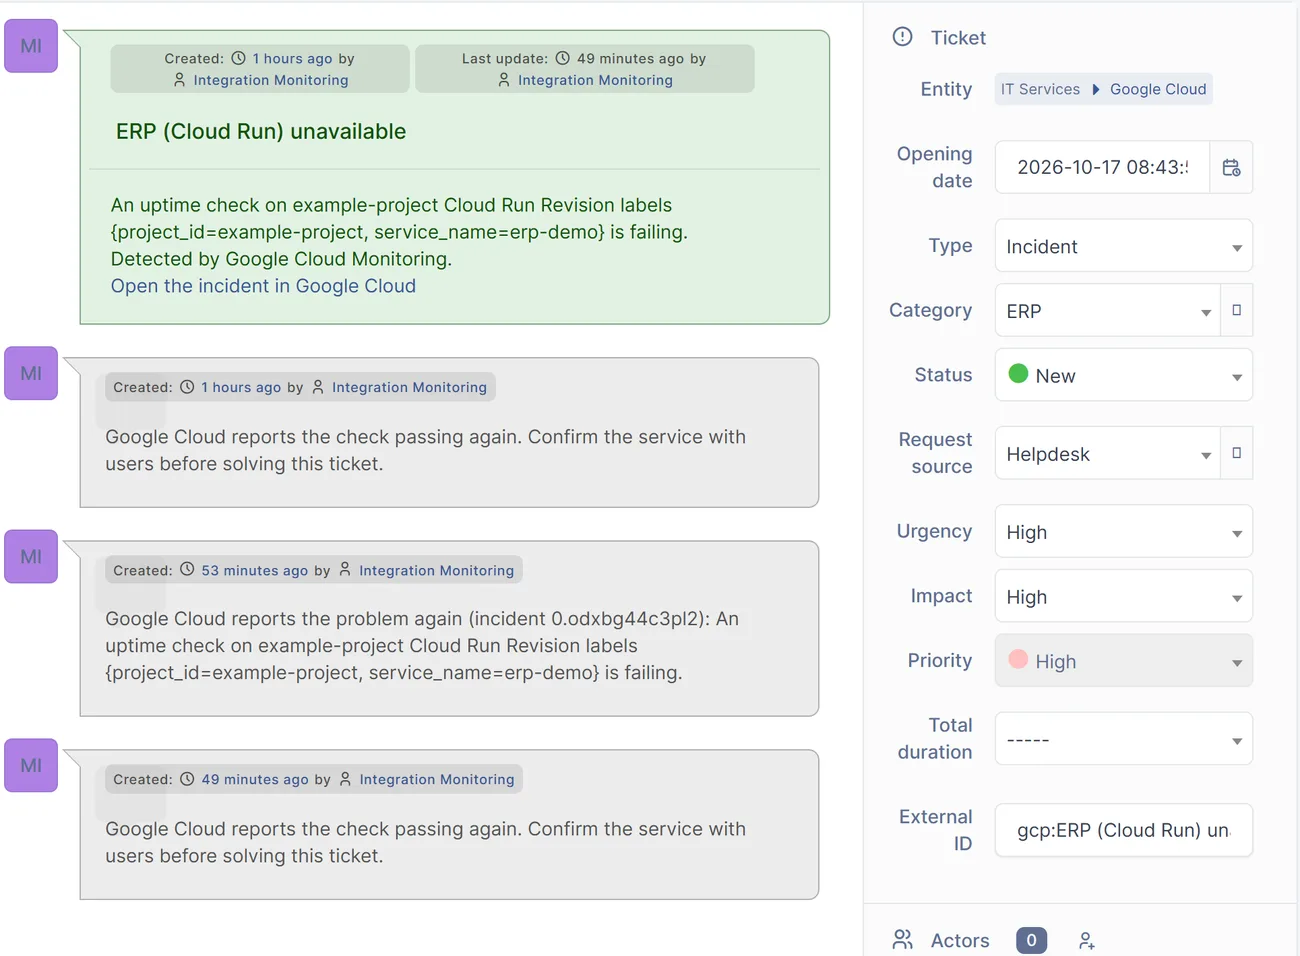
We designed the function around the service desk:
- One ticket per affected service while that ticket is open.
- Every later notice is a follow-up: the recovery, the second failure seven minutes later and the second recovery.
- No automatic solving. The last follow-up asks the desk to confirm the service with users.
AWS and Azure offer the same building blocks: a CloudWatch alarm with SNS and Lambda, or an Azure Monitor alert with an action group and a function. We verified the pattern on Google Cloud only.
Under the hood
One ticket or three: what decides it
Monitoring tools report events. A service desk manages services. The integration decides which of the two GLPI records.
In practice: key alert tickets on the affected service, add repeats and recoveries as follow-ups, and leave solving to a person who can confirm the service with users.
Behaviour of Zabbix's GLPI webhook and a custom Google Cloud function, verified on GLPI 11.0, Zabbix 7.0 and Google Cloud, October 2026.
Before anything is created, the integration checks
- 1Does the alert carry a key for the affected service?Yes
NoEvery alert event becomes its own ticket. This is how the stock Zabbix webhook works.
- 2Is a ticket for that service still open?Yes
NoA new ticket is opened and linked to the service record.
The outcome
Side by side, the paths show a trade-off between detection speed and how the record is structured.
Source: MarifeX reproduction of the scenario on standard GLPI.
| No monitoring | Zabbix, stock webhook | Google Cloud, custom function | |
|---|---|---|---|
| Failure until the service desk knows | 22 min 37 s | 1 min 02 s | 3 min 38 s |
| Records for one failing service | 9 ERP tickets, one per report | 3 tickets | 1 ticket, 3 follow-ups |
| ERP reports left uncategorised | 1 of 9 ERP reports | none | none |
| Linked to the affected service | no; a ticket rule could add it | no; a ticket rule could add it | yes, the ERP service record |
| When the service comes back | nothing changes | ticket solved within 27 s, unattended | follow-up only, ticket stays open |
Source: MarifeX reproduction of the scenario on standard GLPI.
- Most of the 22 minutes came from configuration. The first email arrived within three minutes; the scheduled mail collection and alert checks added most of the rest, and both intervals can be shortened.
- The fastest path made the most noise. Zabbix detected the failure in a minute but left three tickets, all closed automatically.
- The cloud path was slower but more useful. One ticket, linked to the service, covered the whole episode and stayed open.
- No plugins were required. Every path used standard GLPI, its REST API and the monitoring each organisation already had.
What we recommend
- 1
Measure your own detection time
Take a test service down and time it until someone at the service desk knows.
- 2
Without monitoring, shorten the schedules
Run the mail collector every minute or two, not every ten, and check alerts on the same rhythm.
- 3
Let users name the service
A short form with a service field routes reports better than guessing from the words in an email.
- 4
Test every alert end to end
For a shared saved search, create its notification, switch it on, give it recipients, and check that a message arrives.
- 5
Key monitoring tickets on the service
Repeats and recoveries belong in the open ticket as follow-ups. With Zabbix, this means extending the stock webhook.
- 6
Leave solving to people
A passing check is a follow-up, not a solution. Then run the incident as in our use case "One outage, forty tickets, one response".