

Zabbix services
Monitoring that tells you what matters, and only that.
We design, deploy and tune Zabbix so alerts are rare, accurate and acted on. Then we connect it to GLPI, so every real problem has an owner and a ticket.
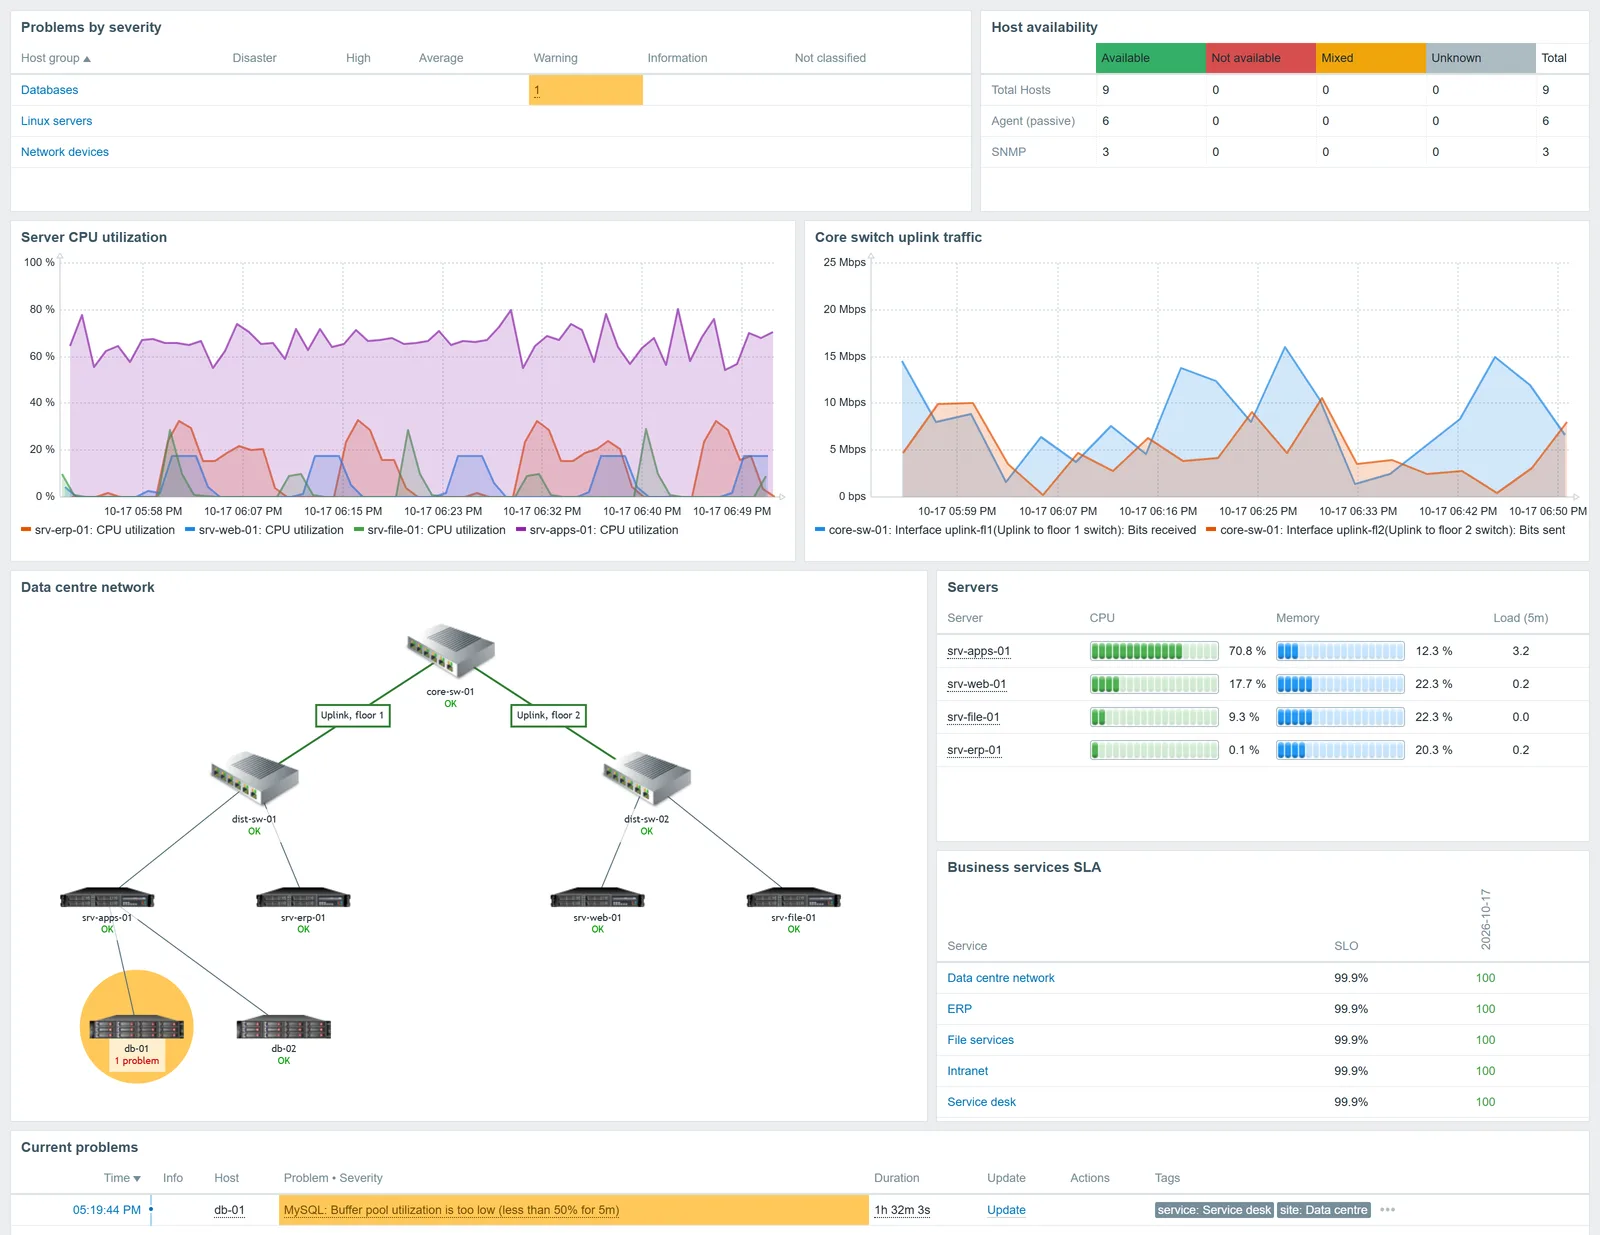
What we do
From the first proxy to the last noisy trigger.
Design and sizing
Server, proxies and database sized for what you monitor today and next year, with high availability where it is worth it.
Deployment
Agents, proxies and templates rolled out in waves, so each group of hosts is checked before the next one starts.
Network and infrastructure
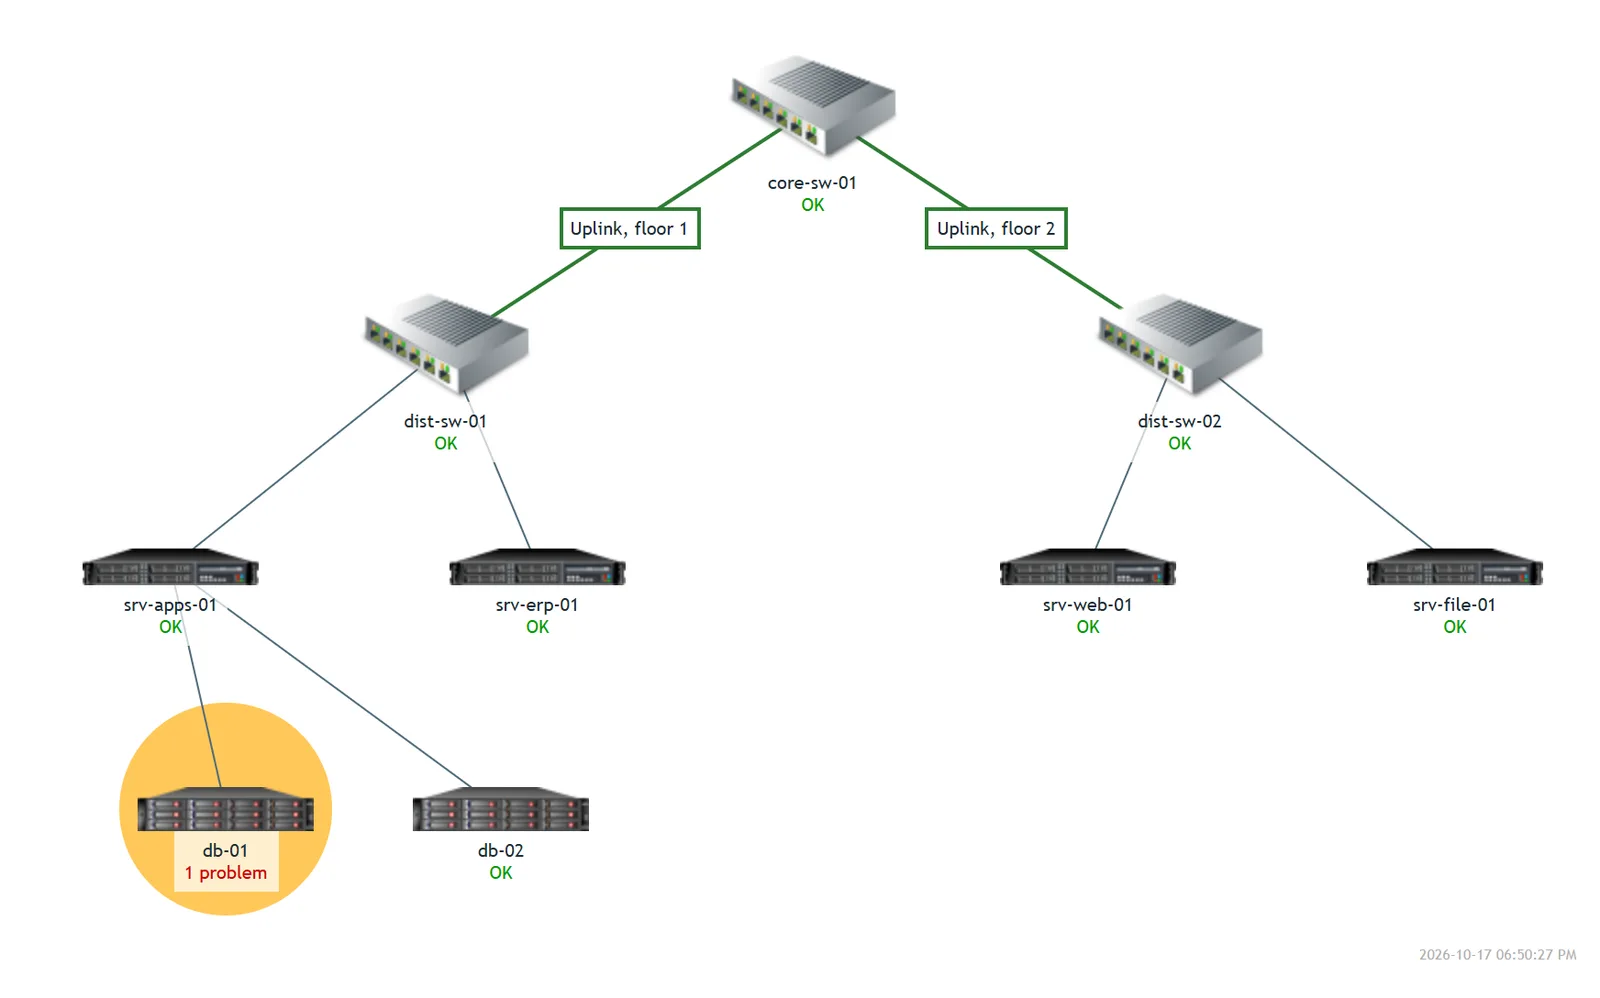
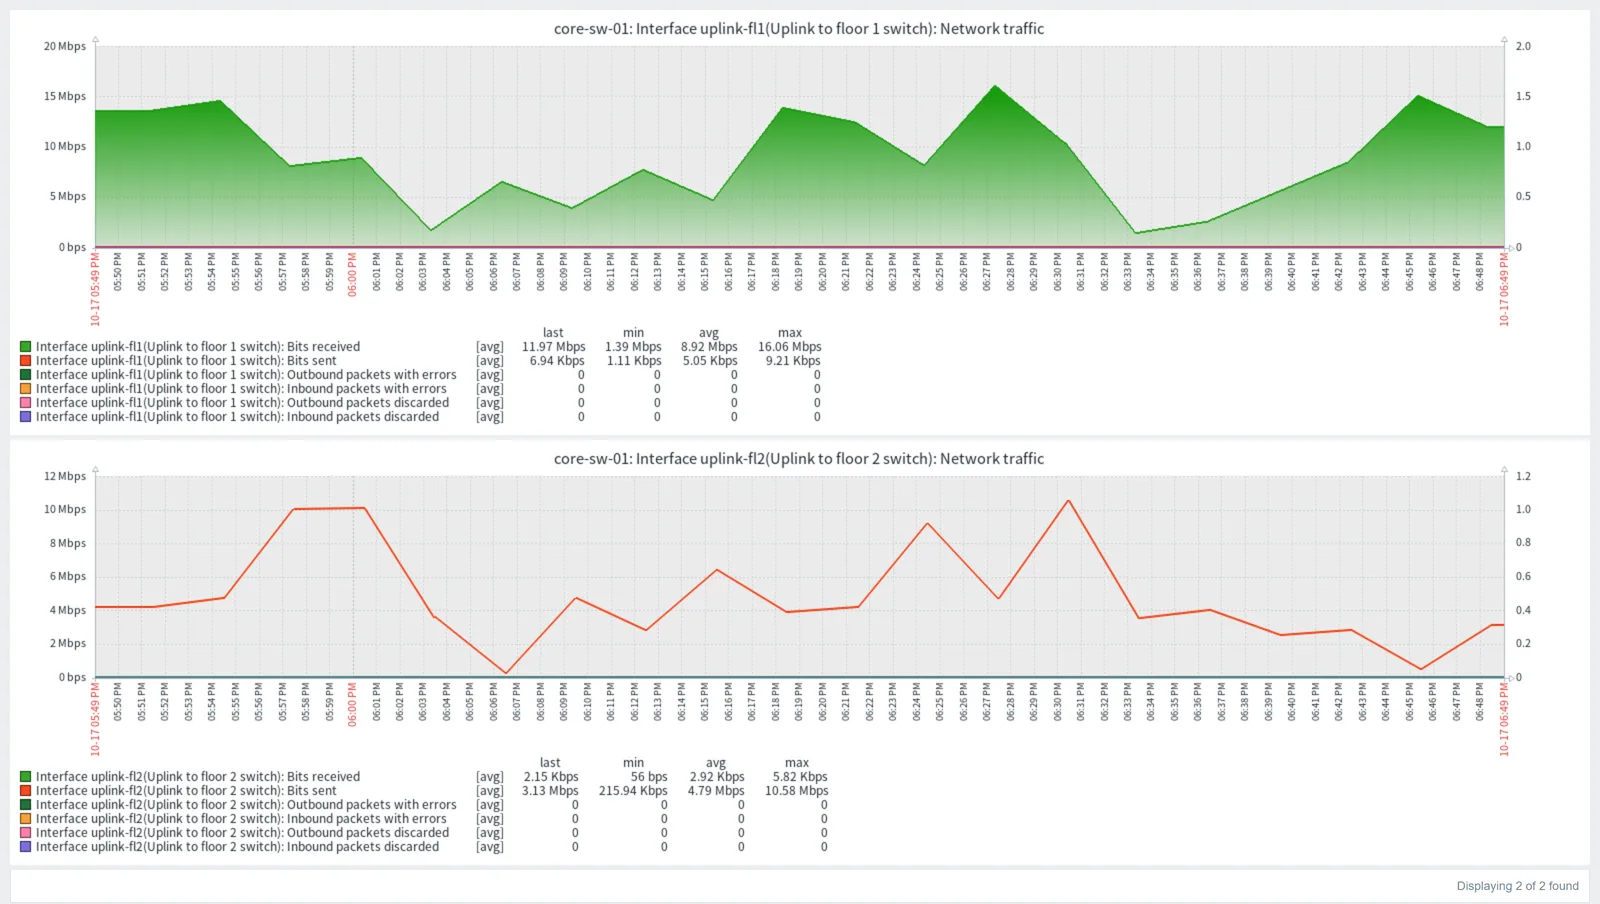
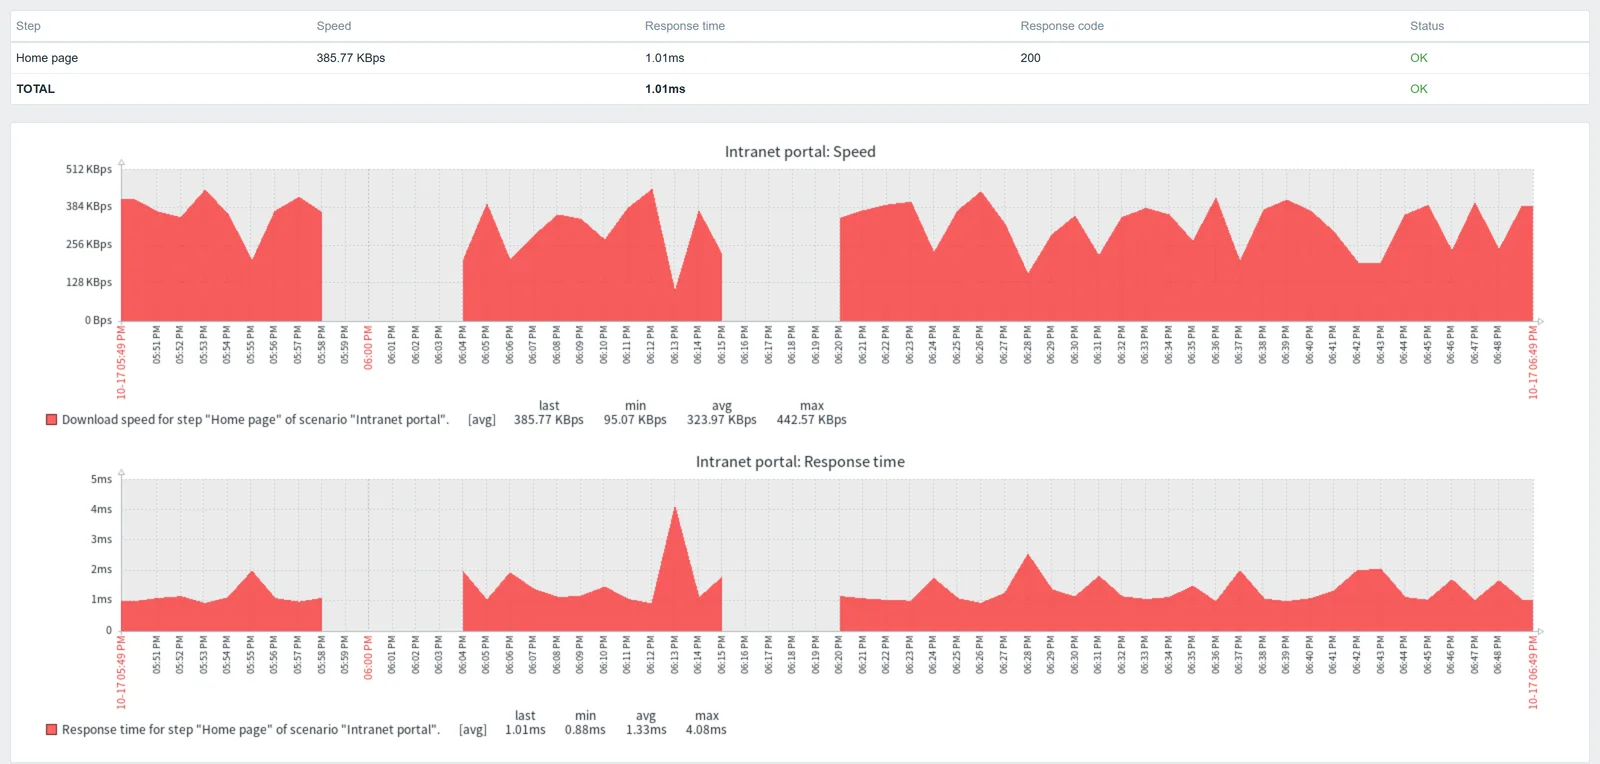
Switches, routers, firewalls and storage over SNMP, plus servers, virtual machines, databases, web checks and cloud.
Templates and triggers
Thresholds tuned to your environment, with dependencies and recovery conditions so one fault raises one problem.
Alerting and escalation
The right people told the right way: email, chat or tickets, with escalation steps and maintenance windows that respect your calendar.
Upgrades and health checks
Version upgrades planned and tested, and regular reviews of housekeeping, performance and the alerts nobody acts on.
In Zabbix
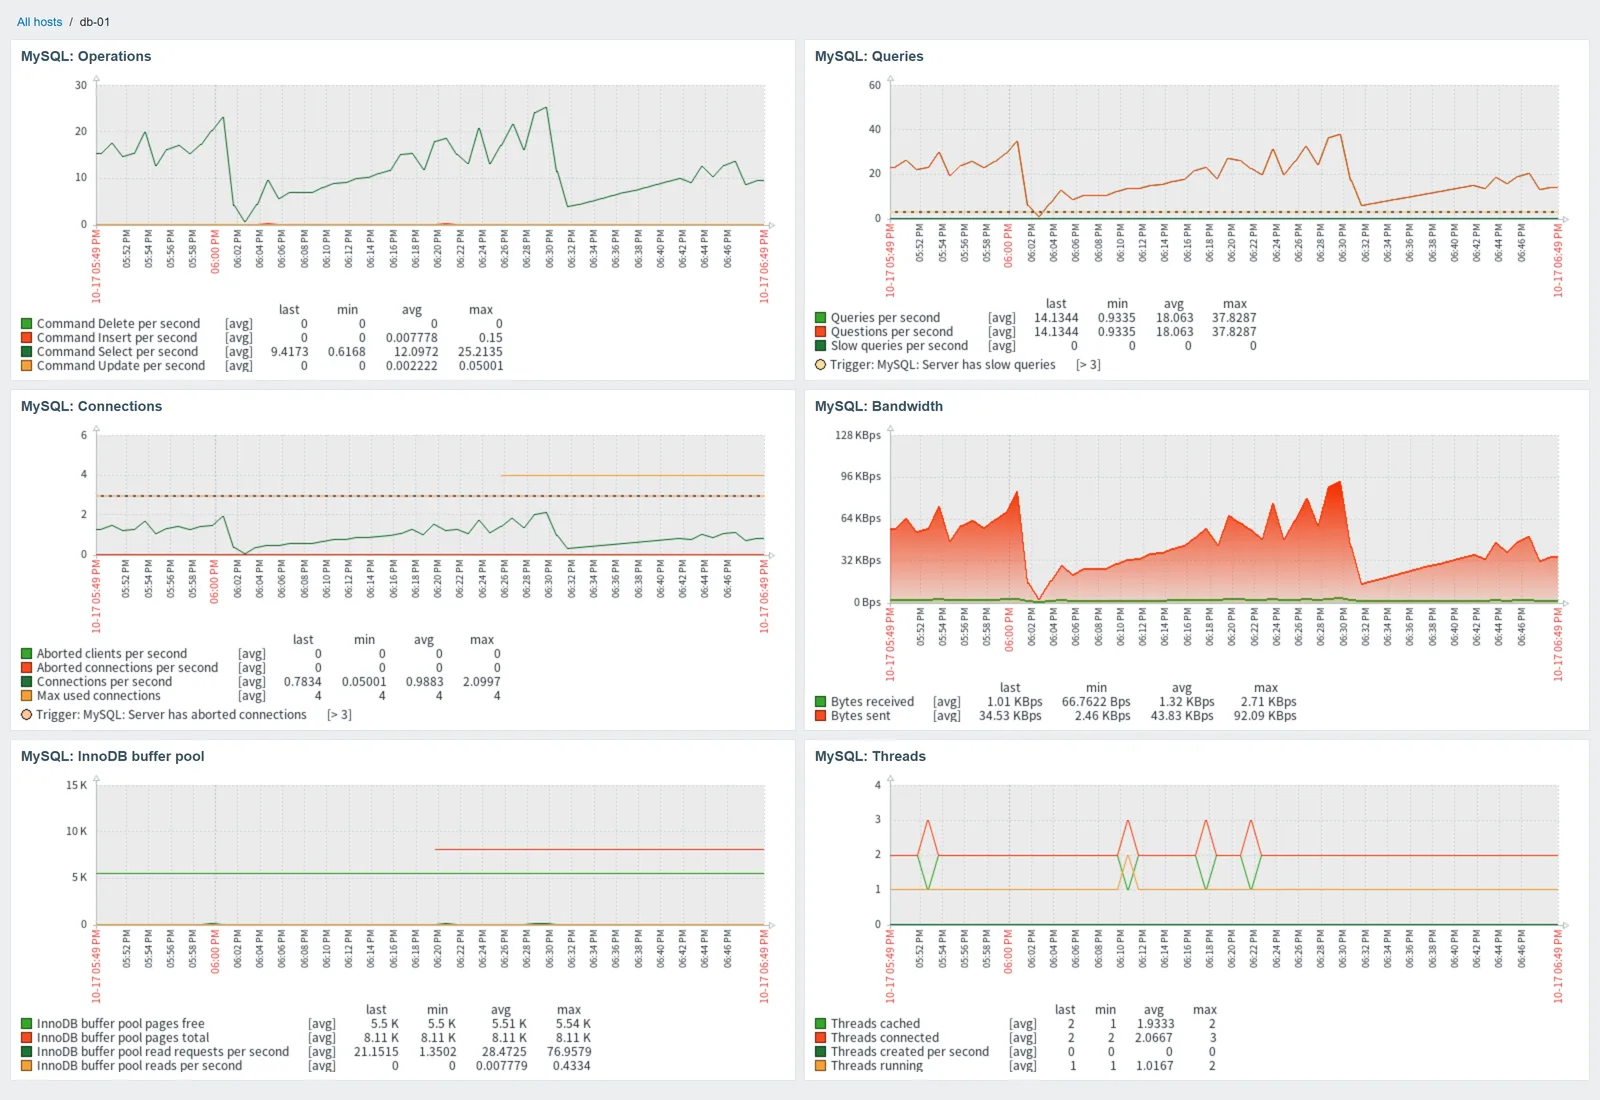
Network, servers, databases and services in one place.
Alert quality
Alert fatigue is a configuration problem.
When people stop reading alerts, monitoring has stopped working. These are the causes we fix most often.
- 01
The trap
Every host alerts on its own
A core switch fails and fifty hosts behind it raise fifty problems, burying the one that matters.
What we do
We set trigger dependencies along the real network path, so you see the switch, not the fifty hosts behind it.
- 02
The trap
Thresholds that flap
A value hovering around a limit opens and closes the same problem all night, and people learn to ignore it.
What we do
We use separate problem and recovery conditions and averages over time, so a problem opens once and closes when it is really over.
- 03
The trap
Default templates on everything
Out-of-the-box templates collect far more than anyone reads and alert on things that do not matter to you.
What we do
We trim templates to what your team actually uses, and tag every trigger so routing and reporting stay simple.
- 04
The trap
Alerts that go to an inbox
An email nobody owns is not an incident. Problems get noticed late or not at all.
What we do
We turn real problems into GLPI tickets with an owner and an SLA, and keep each ticket in step as the problem changes in Zabbix.
Zabbix and GLPI
Every real problem becomes a ticket with an owner.
This is the link most teams never finish. We build it with tools both platforms already have.
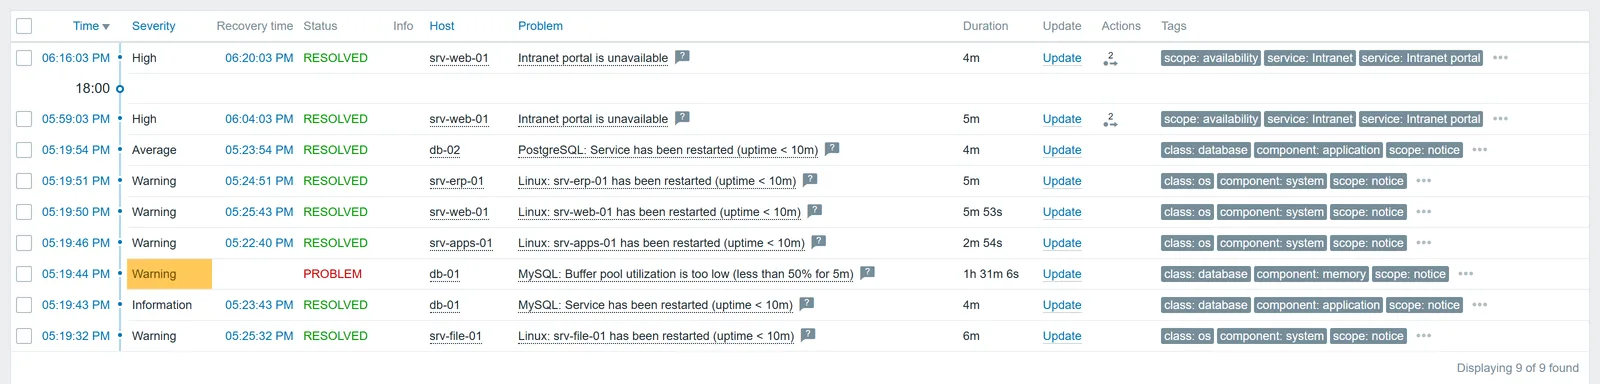
Problem raised
Zabbix detects the problem and tags it with the service and severity.
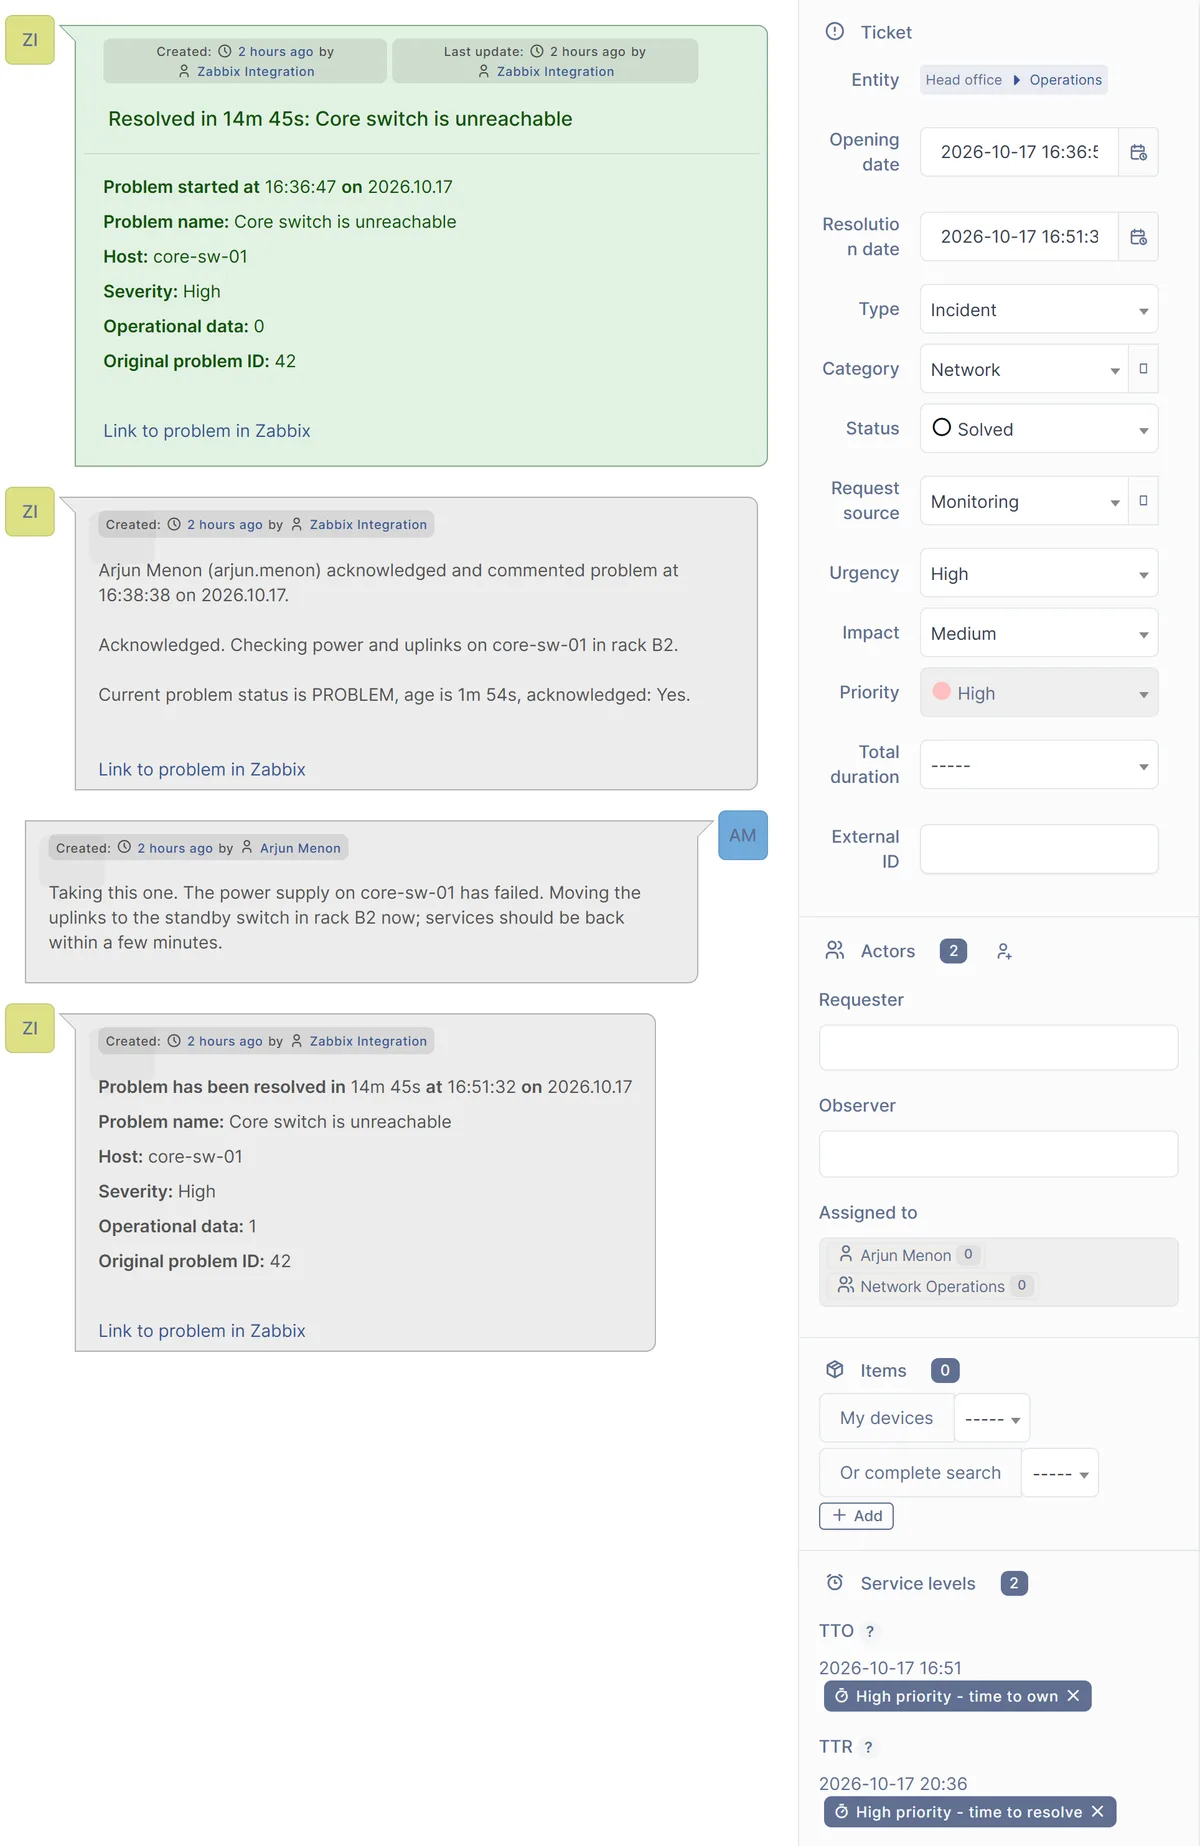
Ticket opened
Zabbix’s own GLPI webhook opens the ticket with the host and problem details. We extend it to link the matching GLPI asset where you need it.
Team assigned
GLPI rules route it to the right group with the right SLA.
Recovery recorded
Updates arrive as follow-ups, and when Zabbix sees recovery the ticket is marked solved, so nobody chases a fixed problem.
What the ticket looks like in GLPI
- Opened by Zabbix with the host, severity, problem ID and a link back to the problem.
- Routed by GLPI rules to the right group, with time to own and time to resolve set.
- The engineer’s acknowledgement in Zabbix arrives as a follow-up.
- Marked solved when Zabbix sees recovery, with how long the problem lasted.
Better together
Connected to the other two.
FAQ
Questions we get asked
Can you work with the Zabbix we already have?
Yes. We start with a health check of the version, templates, triggers, housekeeping and alerting, and give you a list of fixes in order of impact before changing anything.
Do you set up Zabbix high availability?
Yes. Zabbix server has a built-in high availability mode with a shared database, and proxies can be grouped. We design it, test failover with you, and document how it behaves.
Agent or agentless monitoring?
Both, depending on the device. Servers usually get the agent, network devices use SNMP, and some services are checked from outside with web or simple checks.
Does the GLPI link need a paid plugin?
No. Zabbix ships an official GLPI webhook, from Zabbix 7.0 onwards, that opens tickets through the GLPI API, adds follow-ups when a problem changes and marks the ticket solved on recovery. We configure it, tune it to your rules, and extend it where you need more, such as linking the affected asset.
Let's shape your monitoring.
A new Zabbix, a review of the one you run today, or alerts that open GLPI tickets on their own. Start with a short call and leave with a clear plan.