

Metabase services
Answers from your service data, without the spreadsheet.
We set up Metabase on top of GLPI and Zabbix so managers can see SLA, workload, asset and uptime numbers for themselves. Knowing GLPI's database from the inside is what makes those numbers right.
What we do
From the first connection to dashboards people actually open.
Setup and hosting
Metabase installed on your servers or in your cloud, with its own application database, backups and upgrades planned in.
Data connections
Read-only connections to GLPI, Zabbix and your other systems, ideally through a replica so reports never slow the live service desk.
Data models
Curated tables that turn raw database structures into business terms: tickets, SLAs, assets, teams and services.
Dashboards
Service desk, SLA, asset and availability dashboards, built with the people who will read them, not for them.
Access and permissions
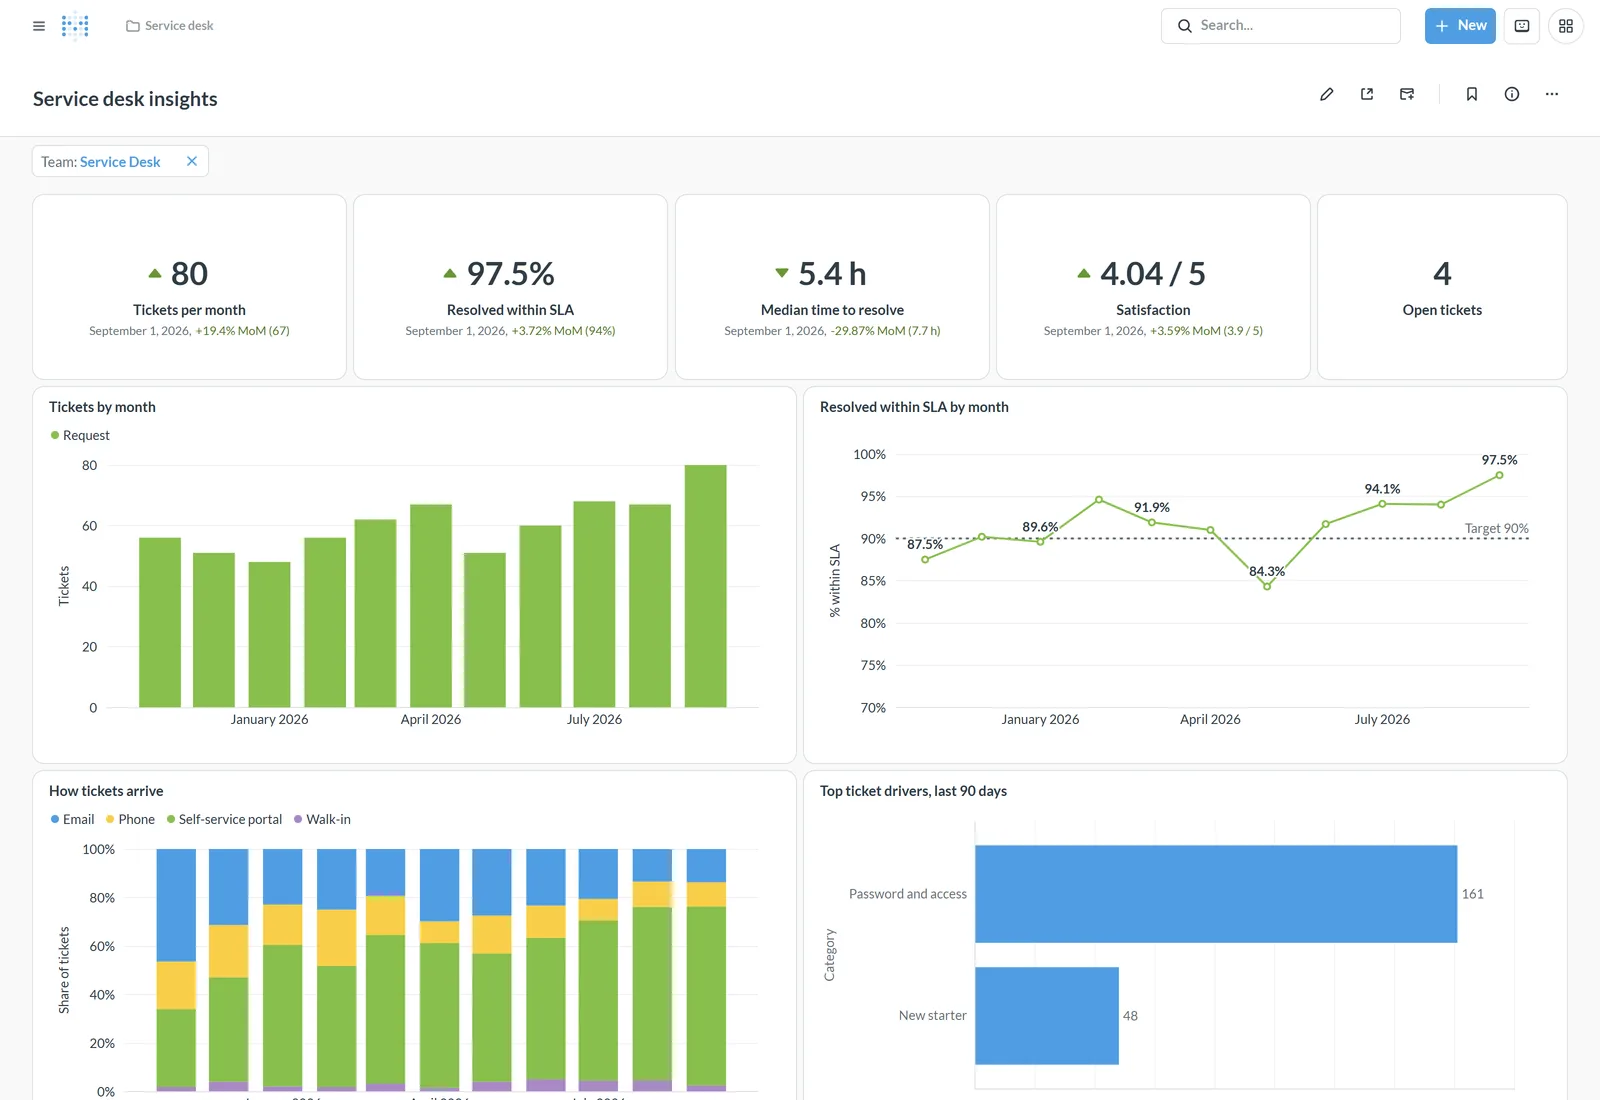
Groups and collections set up so each team sees its own numbers and managers see across teams.
Subscriptions and alerts
Dashboards delivered by email on a schedule, and alerts when a number crosses the line you care about.
Inside GLPI
The whole dashboard, where your team already works.
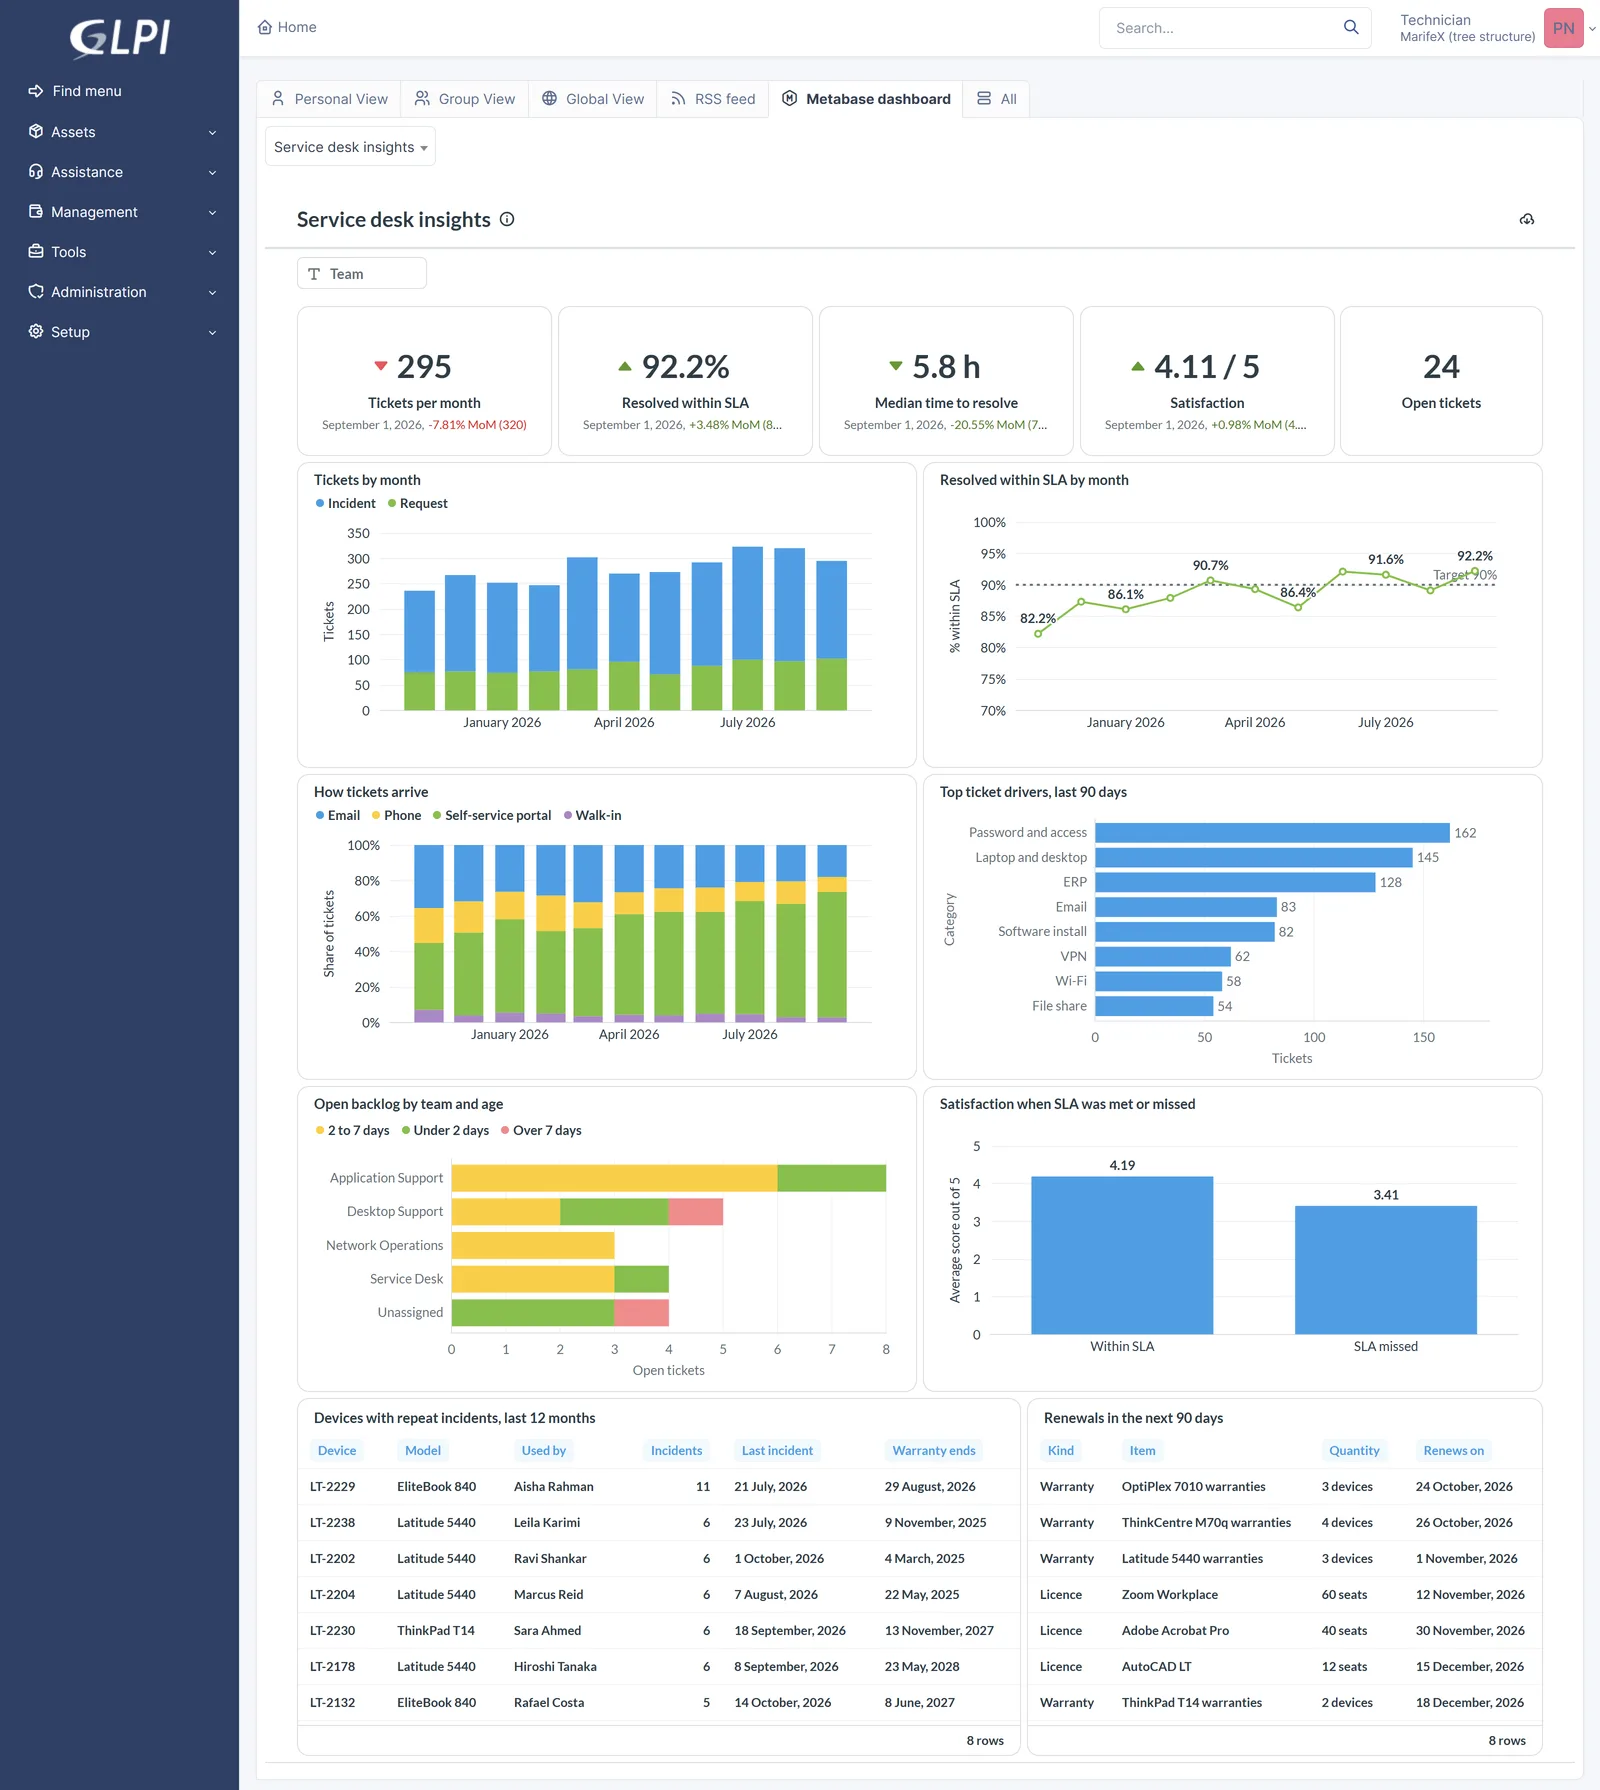
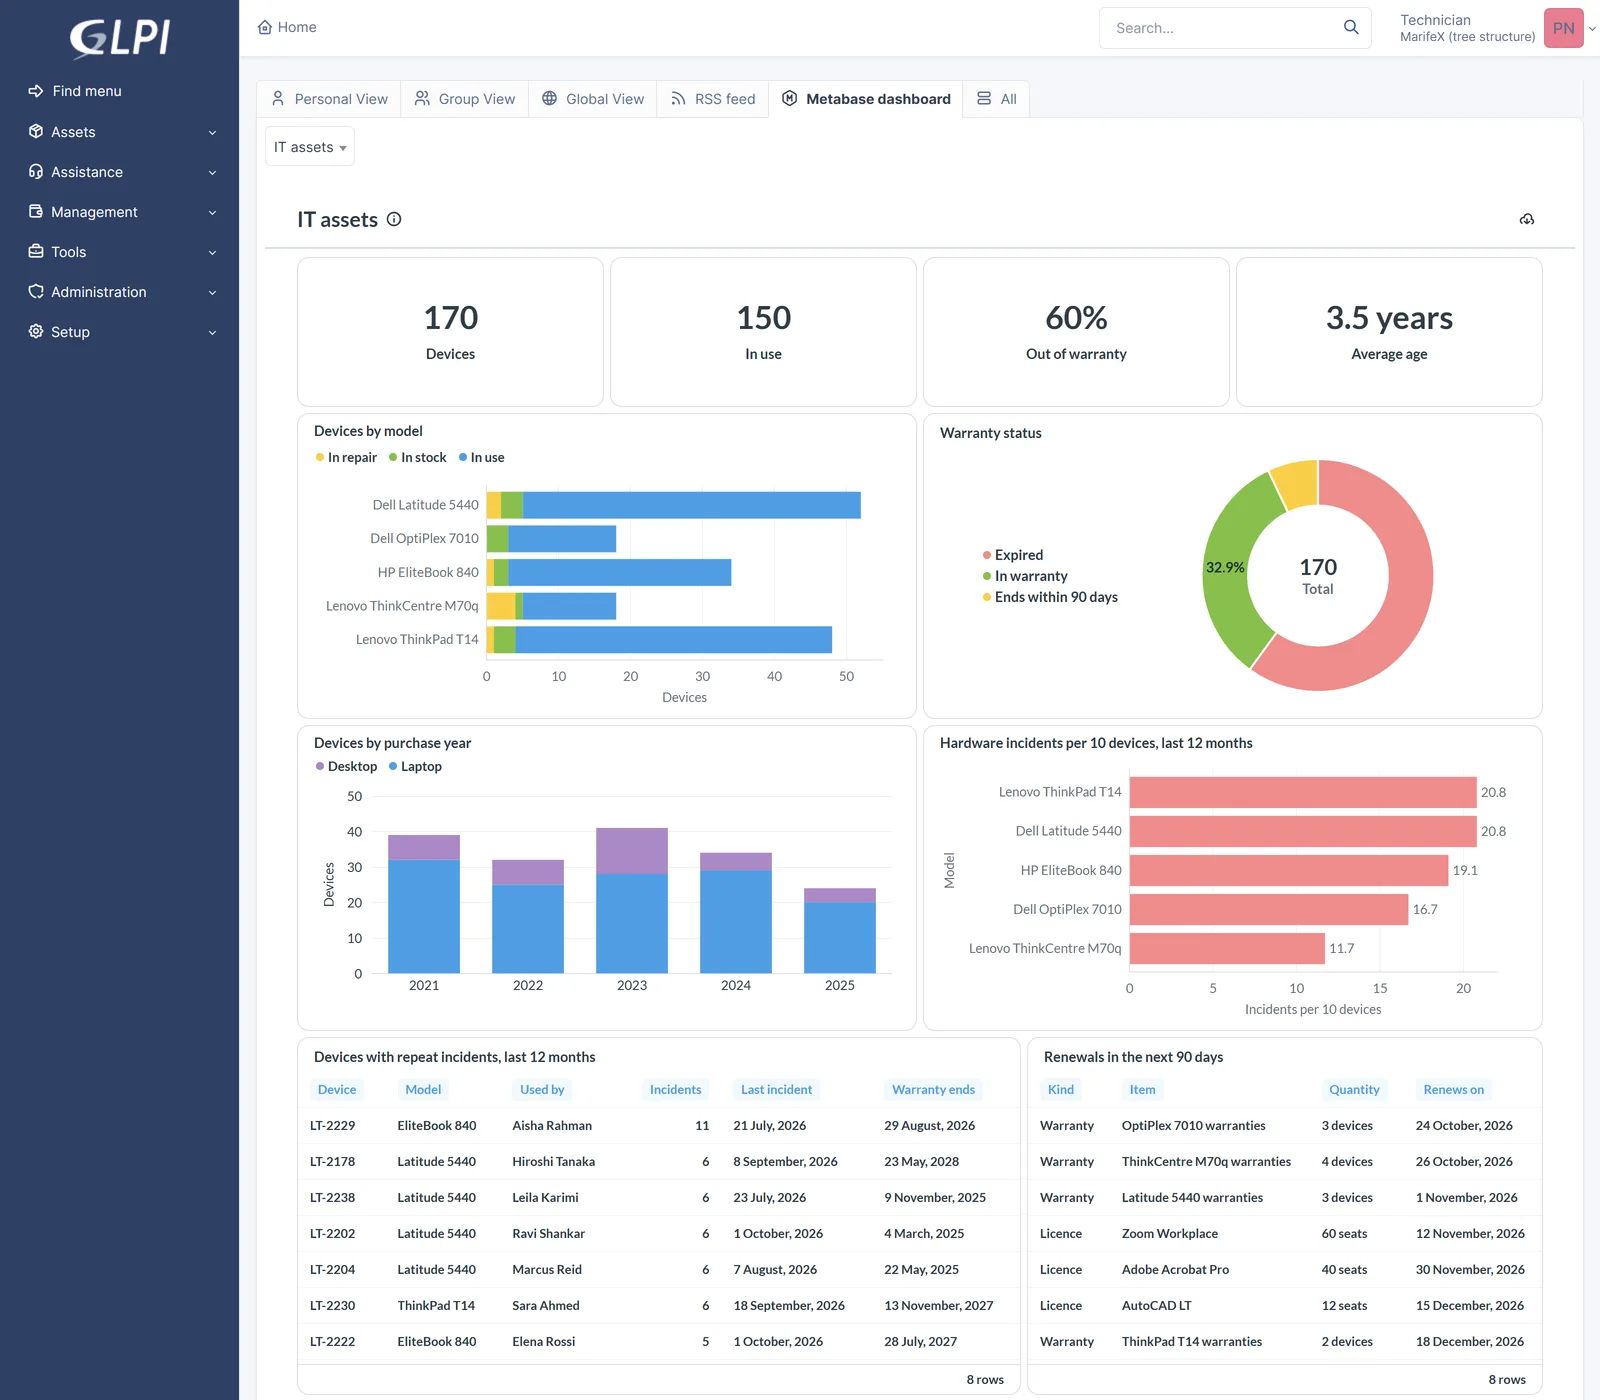
With the Metabase plugin for GLPI, dashboards open on GLPI's home page, and each GLPI profile sees only the dashboards it is allowed to. Nobody needs a second login or another tab. Select a screen to see it full size.
In Metabase
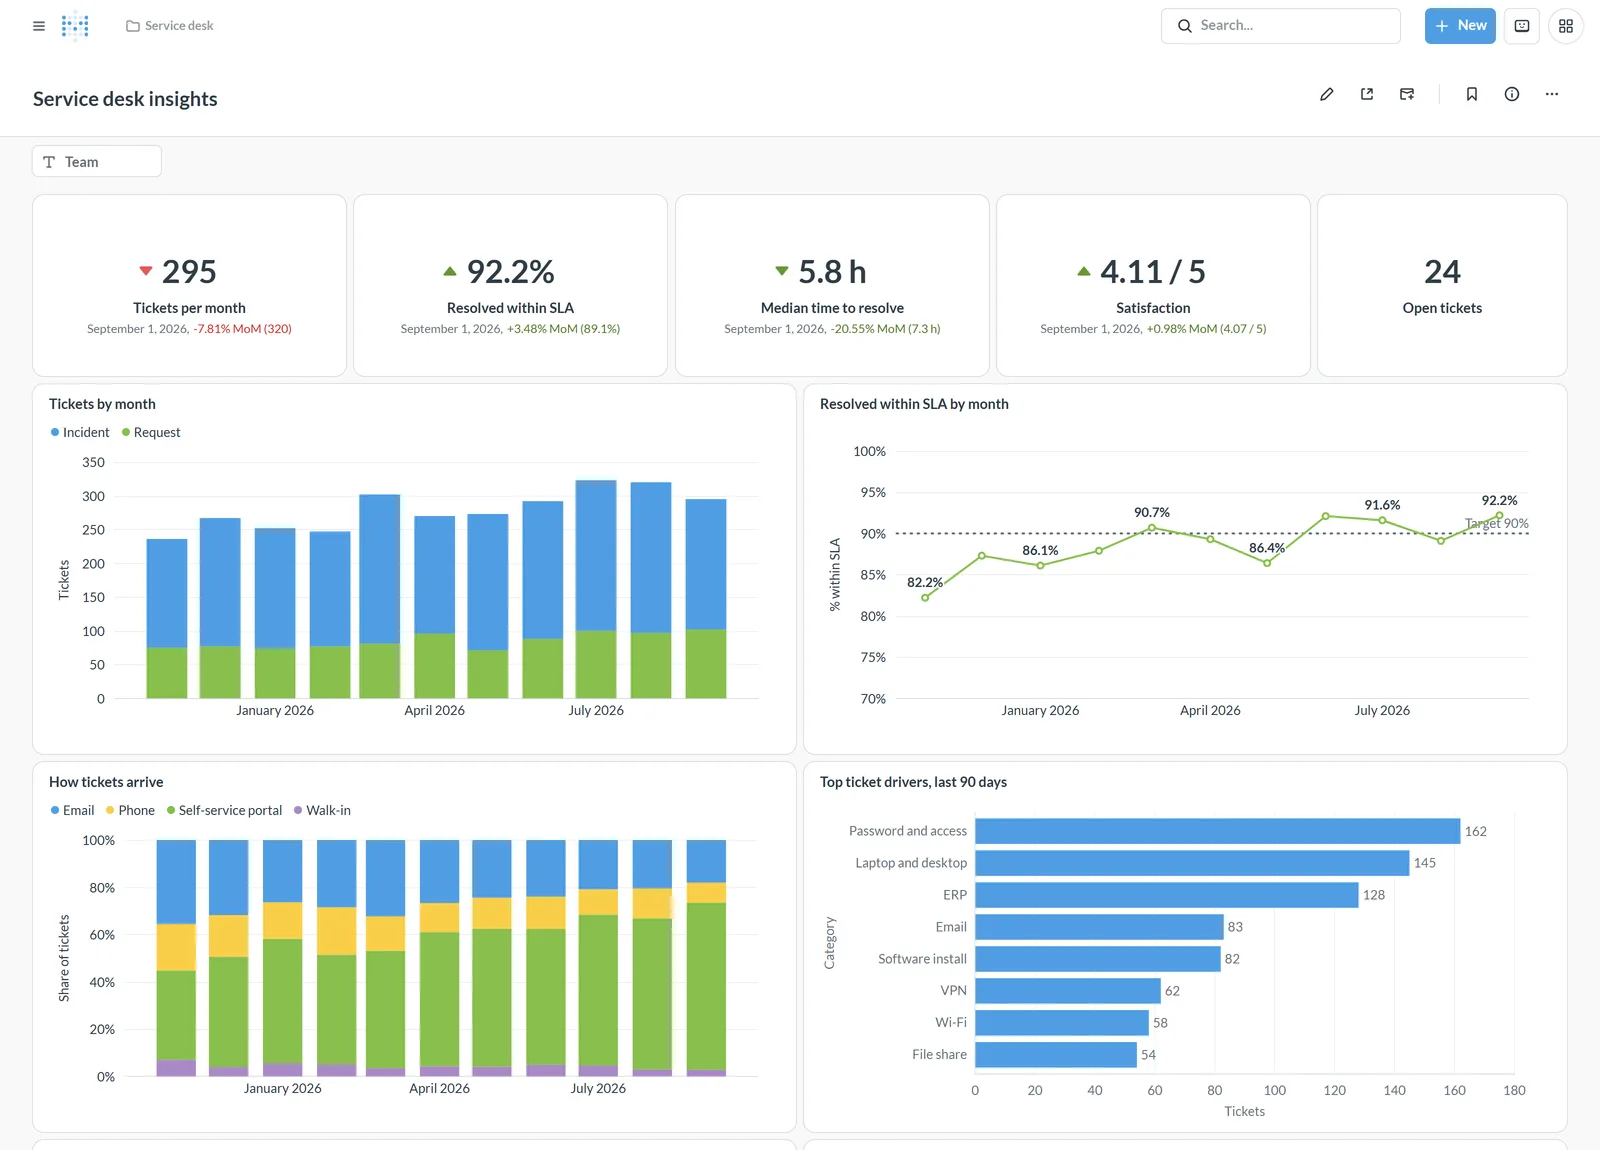
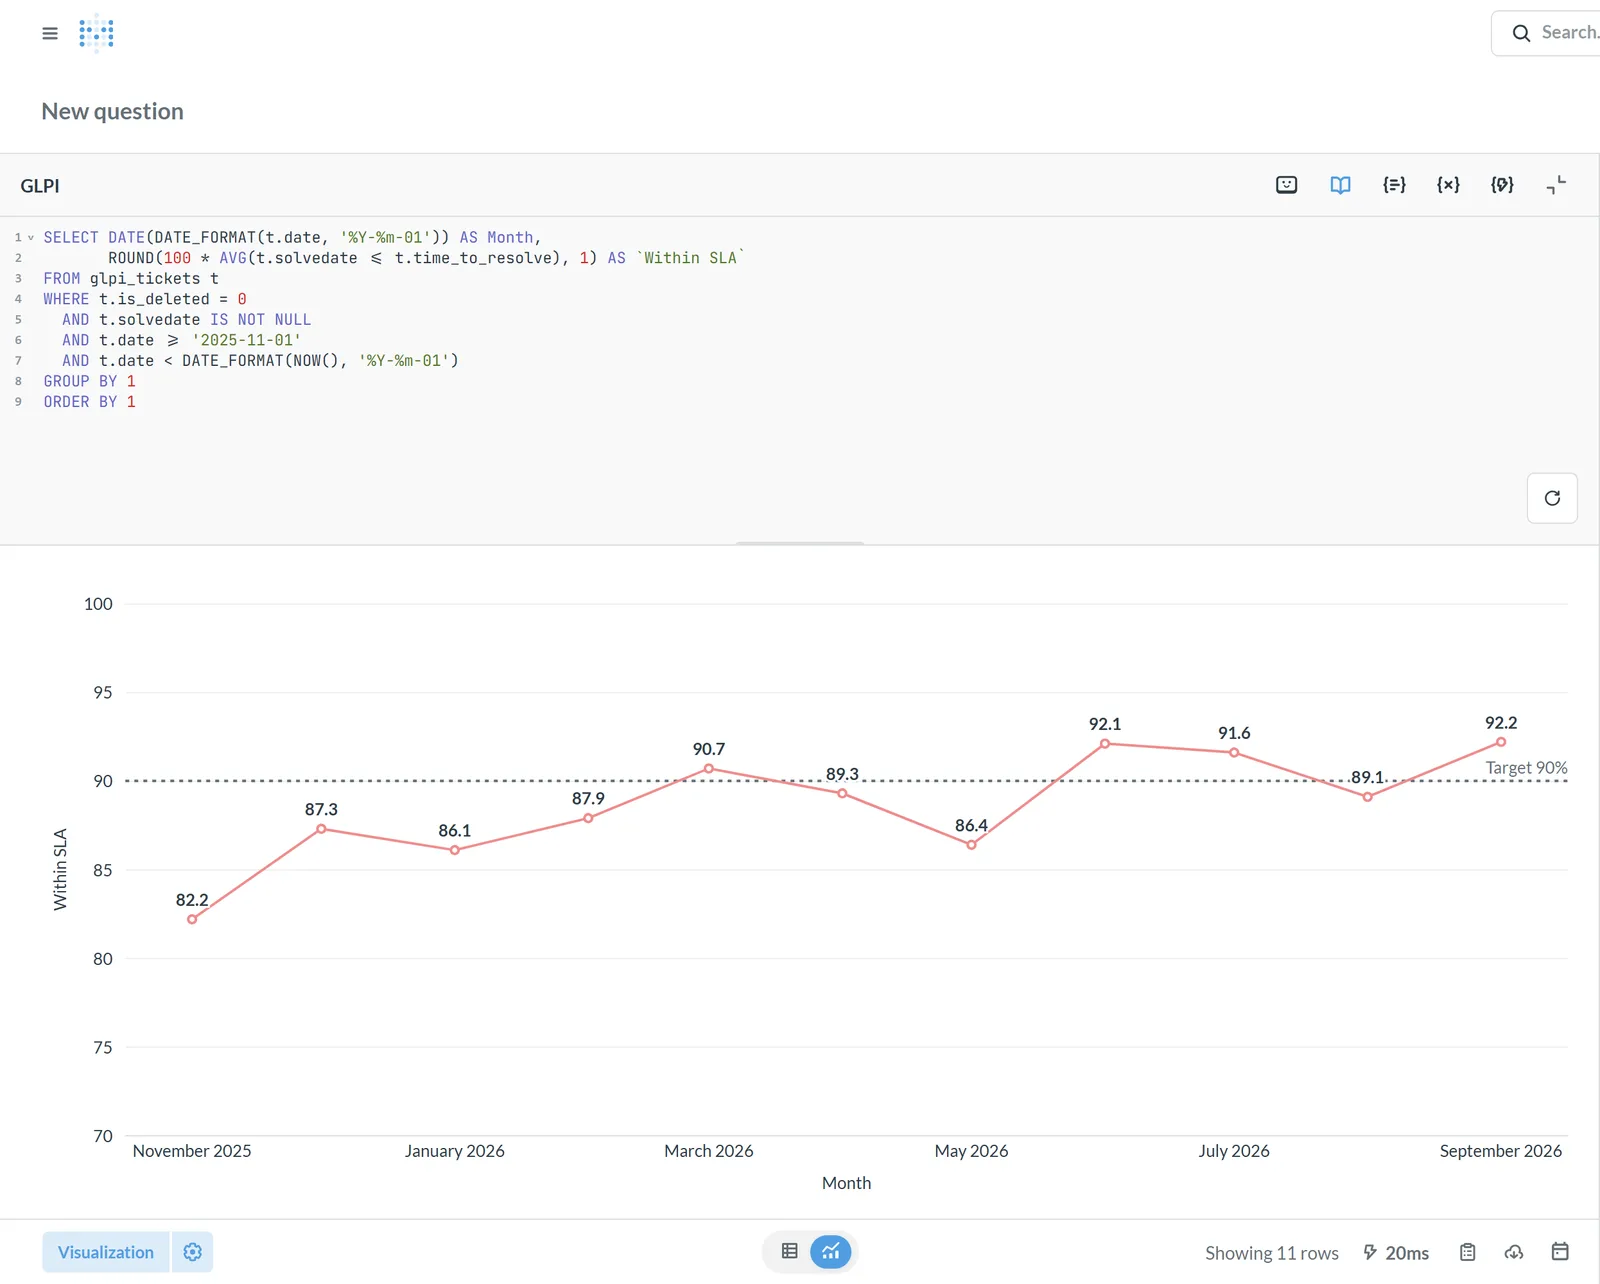
Service levels, workload and assets on one screen.
Built on GLPI's own rules
Numbers that match what GLPI shows.
Reports earn trust when every figure agrees with GLPI. We build each model the way GLPI itself counts, labels and scopes its data.
Each ticket counted once
A ticket can have several technicians and groups. Our models count it once and credit the work to everyone involved.
The words your team uses
Status, priority and type appear as they do in GLPI: Solved, High, Incident, so reports read the way the service desk talks.
The same scope as GLPI
Items in the trash stay out and the entity tree is followed, so each manager sees their own region and the offices under it.
The service desk left alone
Reports run on a read-only copy of the database, so a heavy question never slows GLPI for the people using it.
What you can ask
Questions your data can answer.
A few we set up often. Once the models are in place, your team can ask its own.
- Which categories breach their SLA most often?
- How long do tickets wait for the requester?
- Which assets raise the most incidents?
- Does downtime in Zabbix match the incidents logged in GLPI?
- How is workload spread across technicians this month?
- Which software licences are close to renewal?
Better together
Connected to the other two.
FAQ
Questions we get asked
Do we need a paid Metabase plan?
Most of what we set up runs on the open-source edition. Some features, such as row-level data sandboxing and SAML single sign-on, are in Metabase’s paid plans. We tell you up front when you would need one.
Will reporting slow down GLPI?
Not if it is set up properly. We connect Metabase to a read-only replica or a reporting copy, so heavy questions never touch the live service desk.
Can our team build their own reports afterwards?
Yes, that is the point. Once the data models are in place, people can ask new questions with Metabase’s query builder without writing SQL. We show your team how.
What about MarifeX Analytics?
MarifeX Analytics is our reporting plugin that runs inside GLPI. Metabase suits teams that want one place for data from several systems. We will help you pick, or use both.
Tell us what you want to see.
A monthly SLA review, an asset report for finance, or one screen that shows service and uptime together. Start with a short call and we will show you how to get there.