

The situation
Every GLPI instance starts fast. Then ticket history builds up, more sites are onboarded and more people work in it at the same time. Teams often find the limits of their server the hard way, when users start reporting that GLPI is slow, and then have to diagnose it under pressure.
The questions behind that are always the same: how many technicians can one server carry, what slows down first, what fails without anyone noticing, and which settings move the limit. There is little measured, public data to answer them, so we measured.
We built GLPI databases with 10,000 to 500,000 tickets and five years of history behind each, and ran them on one server with 4 vCPU and 16 GB of RAM. Then we simulated a working day, adding technicians in steps up to 100, well past the point where the server ran out of capacity, and changed the configuration in steps. The goal is a set of figures a team can use to size GLPI before it grows, not after.
How we tested
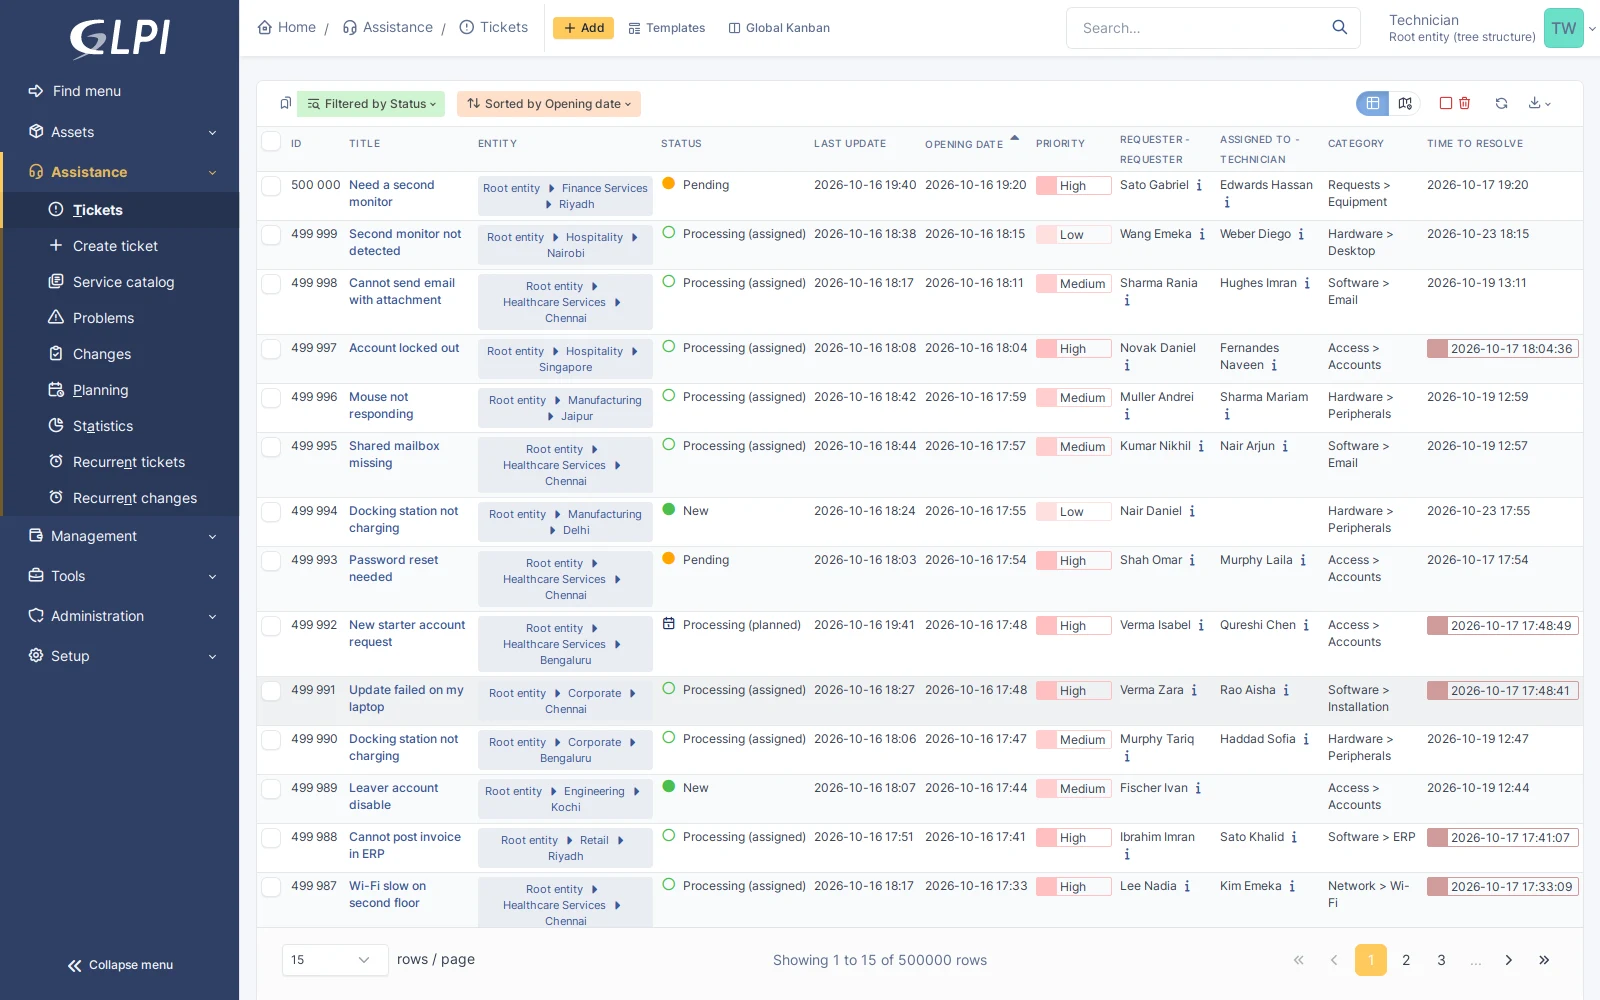
The data was generated to match a typical multi-site service desk. Each database has users at one per 50 tickets and technicians at one per 5,000, an entity tree that grew to 49 entities over the years, 302 GLPI 11 forms whose questions changed over time, attachments on about a fifth of the tickets, a knowledge base, office-hours SLAs, routing rules, the Fields plugin for custom ticket fields, and a full hardware and software inventory.
The ticket count measures history more than team size. Over five years, 500,000 tickets is 100,000 a year, which a team of 30 technicians reaches at about 13 tickets each per working day.
During every load test the server also handled what a real day brings: email arriving through the mail collector, notifications going out, a REST API integration, inventory agents reporting and reporting queries every five minutes. The load generator ran on a separate machine.
- One user, growing data. A real browser timed 22 everyday screens, 20 times each, at 10,000, 100,000 and 500,000 tickets, and recorded the database work behind each screen.
- Many users, one database. Requests recorded from a real browser were replayed by simulated people. Each step adds technicians (10, 25, 50, 75, 100) with two self-service users per technician and a supervisor per ten, and runs for ten minutes. The first two minutes of each step are not counted. The higher steps are not a capacity claim: they push the server well past its limit to show what slows down and what fails first.
- Configuration in steps. Default configuration, then database memory sized to the data, then a tuned configuration (section 09). The tuned run was repeated, and run with three different Apache worker limits. Most tuned runs also used a newer GLPI version with the form fix from section 05, so they differ from the memory-sized runs in more than configuration.
- Events that happen in real life. A major incident with a burst of 300 emails and 100 observers on one ticket, a backup during working hours, a database restart and a crash-like cold start, and one computer linked to thousands of tickets.
- Questions from the community. Session locking and Redis, history growth, entity scope, backup, restore and upgrade times.
How fast our technicians worked. Each simulated technician opened about 170 screens an hour, which is faster than most people work. To compare with your own team, scale our technician counts by your pace: if your technicians open about 85 screens an hour, our 10 technicians correspond to about 20 of yours. The mix of screens is in section 09.
What counted as acceptable. We fixed the thresholds before the tests: 95% of everyday screen loads under 2 seconds, 95% of saves under 3 seconds, and fewer than 0.1% errors. Everyday screens are opening a ticket, the open-ticket list, text search and the home, self-service and catalogue pages. Wide screens (all tickets by date, global search, statistics and dashboards) are reported separately: at 500,000 tickets the lists, searches and statistics among them took 4 to 7 seconds even for one user (Exhibit 1). Screen times are measured until the page is idle in the browser, which adds about half a second to every screen.
Versions. The default and memory-sized runs used GLPI 11.0.8, as did one tuned run. The other tuned runs used GLPI 11.0.11 with the form fix described in section 05. Opening a ticket measured the same on both versions, but saves measured slower on 11.0.11, even below saturation, and we could not isolate the cause; the comparison is in section 09.
Limits. All results come from one server size, so treat the numbers as ratios and warning signs rather than guarantees. The study does not cover:
- Customer data. The data is generated, and its email text is shorter and cleaner than real mail.
- Upgraded databases. Every database was installed fresh on GLPI 11.
- Other plugins. Fields was the only one. Each plugin can add work to every screen and save; this one produced one of the four heaviest queries.
- Cloud mail. Mail went through a local server, not Microsoft 365 or Google, whose sending limits come on top (section 05).
- Daily scheduled tasks. Automatic closing, alerts and the logs purge did not run during the measured steps, so the mail delays we measured are a best case.
- Other conditions. More than 49 entities, users far from the server, PHP-FPM, nginx or MySQL, and bursty peaks. Our users sat next to an Apache prefork and MariaDB 10.11 server under steady load.
Data size on its own
With one person using a tuned server, more history did not slow down everyday work. Self-service, the service catalogue, knowledge base and FAQ stayed between 0.75 and 0.95 seconds from 10,000 to 500,000 tickets. Opening a ticket went from 1.7 to 1.9 seconds and the list of open tickets from 0.9 to 1.1.
The screens that look across all tickets are different. The full ticket list sorted by date, global search and yearly statistics grew four to seven times.
On those screens almost all of the time is spent in the database, and PHP’s share did not change with size. At 500,000 tickets the full ticket list spent 5.9 seconds in the database and read 4.5 million rows; global search spent 4.8 seconds on 3.4 million rows; yearly statistics 3.3 seconds on 3.9 million.
- All tickets by date
- Global search
- Yearly statistics
- Submit a form
- Self-service home
Source: MarifeX measurements on one GLPI server, 4 vCPU and 16 GB RAM.
On a default installation the same data looks much worse. Submitting a form took 17.9 seconds at 500,000 tickets instead of 2.3, yearly statistics 17.0 instead of 4.3 and adding a follow-up 12.9 instead of 2.6. Most of that difference is the database memory setting described in the next section.
Two smaller costs grow with the data on every save and view:
- Notification counters. Every save prepares notifications, and the notification data includes two ticket counts for the entity, computed whether the template uses them or not; none of GLPI’s default templates does. One of them, the number of incoming tickets, also counts solved and closed tickets, so it reads almost the entity’s whole history. At 500,000 tickets these counts were the largest part of the database work in a form submission (0.6 seconds), and under load the same query was the second heaviest on the server. We reported this to the GLPI project.
- Custom fields lookup. Opening a ticket with the Fields plugin looks up the ticket’s custom field values with a query the database cannot serve from its index, so it reads the plugin’s whole table (290,000 rows at 500,000 tickets). That added about 0.25 seconds per ticket view for one user, and under load it was one of the four heaviest queries on the server. We reported it to the plugin project.
Many people at once
The default configuration
On a default installation, MariaDB keeps 128 MB of data in memory. At 500,000 tickets the database is about 5 GB, so almost every request reads from disk. Our disk was a premium SSD rated at about 125 MB/s, and the results in this section depend on its speed.
With 10 technicians, opening a ticket already took 6.4 seconds and adding a follow-up 33 seconds. At 50, a follow-up took over two minutes, Apache reached its limit of 150 workers and the database used 144 of its 151 connections. The two default limits are almost the same number, so the web server can exhaust the database before it runs out of workers itself.
Database memory sized to the data
We changed one setting: the InnoDB buffer pool, from 128 MB to 8 GB, so the whole database fits in memory. Nothing else.
With memory sized to the data, 10 technicians at 500,000 tickets were fast again (1.0 seconds to open a ticket) and reporting queries that took 84 seconds finished in 2.5. At 100,000 tickets the same server met our thresholds at 10 technicians and just missed the save line at 25 (adding a follow-up took 3.03 seconds at the 95th percentile). At 50 opening a ticket took 2.2 seconds, 6.1 at the 95th percentile, well past the line, and the server saturated by 75.
- 500k, default
- 500k, memory sized
- 500k, tuned
- 100k, memory sized
Source: MarifeX measurements on one GLPI server, 4 vCPU and 16 GB RAM.
The tuned runs are slower per screen past saturation than memory sizing alone, because they do more of the real work: the collector takes up to 50 emails a minute instead of 10 every ten minutes, more notifications go out, and every form submission completes.
Where the limit is
At 500,000 tickets the tuned server ran out of CPU between 10 and 25 technicians; every step above that shows it overloaded. By our own thresholds it already failed at 10. The CPU was 42% busy and opening a ticket took 1.1 to 1.2 seconds (1.6 to 2.1 at the 95th percentile), but text search and form submissions reached up to 2.4 seconds at the 95th percentile, and adding a follow-up 4.4 to 5.2 seconds, above our 3-second line for saves. Adding a follow-up took 2.6 seconds even for one user (section 03), so that miss comes from the work each save does more than from the load. The server completed about 88 screens a minute at 10 technicians and about 190 at 25, where the CPU was 96 to 99% busy and opening a ticket took 3.2 to 4.5 seconds (5.6 to 6.9 at the 95th percentile). We ran this configuration three times: below saturation the runs agreed closely, while at the edge of saturation they differed by up to 40% (section 09).
- Database (MariaDB)
- Web and PHP (Apache)
- Other
Source: MarifeX measurements on one GLPI server, 4 vCPU and 16 GB RAM.
At 500,000 tickets the database uses about two thirds of the CPU, and the heaviest queries are the ones that look across everything: the full ticket list sorted by date, text and global search, yearly statistics and dashboard cards. At 100,000 tickets the split was close to even.
What the Apache worker limit changes
Apache’s worker limit caps how many requests run at once. We ran the tuned configuration with 150, 48 and 24 workers.
Below saturation it made no difference: at 10 technicians all three gave the same times. At 25, 48 workers stayed close to 150, while 24 already slowed users down. Past saturation the limit decides who waits.
With 150 workers users get the fastest screens and the server completes the most work (267 screens a minute at 50 technicians, against 191 with 48 workers and 148 with 24). But scheduled tasks run outside Apache and compete with all those requests for the database, so notifications fell 6 to 14 minutes behind and 594 to 970 were still unsent at the end of the run. With 48 or 24 workers, notifications and email intake kept their normal pace at every step, and users waited longer instead.
- 150 workers
- 48 workers
- 24 workers
Open a ticket (median)
Notification sent after (95th percentile)
Source: MarifeX measurements on one GLPI server, 4 vCPU and 16 GB RAM.
The worker limit cannot add capacity. It only chooses whether people or background work wait. The real answers past saturation are more CPU or less work per screen.
What fails quietly
Slow screens are visible. The problems below are not: nothing on screen tells the service desk that they are happening.
- 01
Email waits in the mailbox
The collector fetches a fixed number of emails per run. When that falls behind, user emails wait and nobody sees it.
- 02
Notifications fall behind
Outgoing mail is sent in batches by a scheduled task that competes with everything else, and waits behind other tasks.
- 03
A major incident floods the queue
Every public follow-up on a ticket with 100 observers queues about 100 emails.
- 04
A task stops for good
A database restart or crash at the wrong moment can stop all outgoing email until someone resets it by hand.
- 05
Form requests fail
Under heavy load, form submissions waited on each other and some failed with an error. This is now fixed in GLPI.
Email intake
A fresh GLPI installation collects email every 10 minutes, 10 emails at a time: at most 60 emails an hour, however powerful the server.
There is a second trap. A common setup uses the service desk mailbox as GLPI’s administrator address too, and GLPI’s default new-ticket notification goes to the administrator. GLPI then sends its own notifications into the mailbox it collects from. The collector recognises them and refuses to turn them into tickets, but each one still uses a place in a run. In one of our runs the mailbox grew from 69 waiting emails to 768 in 45 minutes while users had sent 101. With a separate administrator address and 50 emails per run every minute, every user email became a ticket.
Notifications and the one-task-at-a-time scheduler
Notifications are sent by the queued notification task, 50 per run by default. GLPI runs its scheduled tasks one at a time: while one task runs, the others wait for the next turn. Normally each run takes seconds and nobody notices.
Under pressure, one slow task holds back all the others. Past saturation each notification batch took a minute or more, and as described above, 594 to 970 notifications were still unsent at the end of a run with 150 workers.
A major incident
We simulated a major incident at 25 technicians: an ERP outage logged as one ticket, 300 emails from users arriving within ten minutes, and technicians posting updates on the incident ticket for its 100 observers.
- The email burst held up the scheduler. Each collector run of 50 emails, each becoming a ticket with its own notifications, took 3 to 7 minutes on the busy server. While it ran, the notification task could run only once or twice in ten minutes. Half of the storm emails waited about 8 minutes or more to become tickets, the slowest 19 minutes, and 1,847 notifications were still unsent at the end. Large batches are a trade-off: they clear a normal day’s email quickly, but in a storm each run holds the scheduler for minutes, and a smaller batch keeps notifications moving.
- Observers multiply every update. 59 public follow-ups on the incident ticket queued 5,960 notifications, one per observer per update, on top of everything else. At the end of the run 7,020 notifications were waiting.
- The ticket itself held up well. 25 technicians opened the incident ticket 118 times and added 59 follow-ups to it with no lock waits.
Our mail server ran on the same machine. Sent from one Microsoft 365 mailbox, which can send 30 messages a minute and reach 10,000 recipients a day (Exchange Online limits), the incident notifications alone would take over three hours, and an incident on a busy day can exhaust the daily limit.
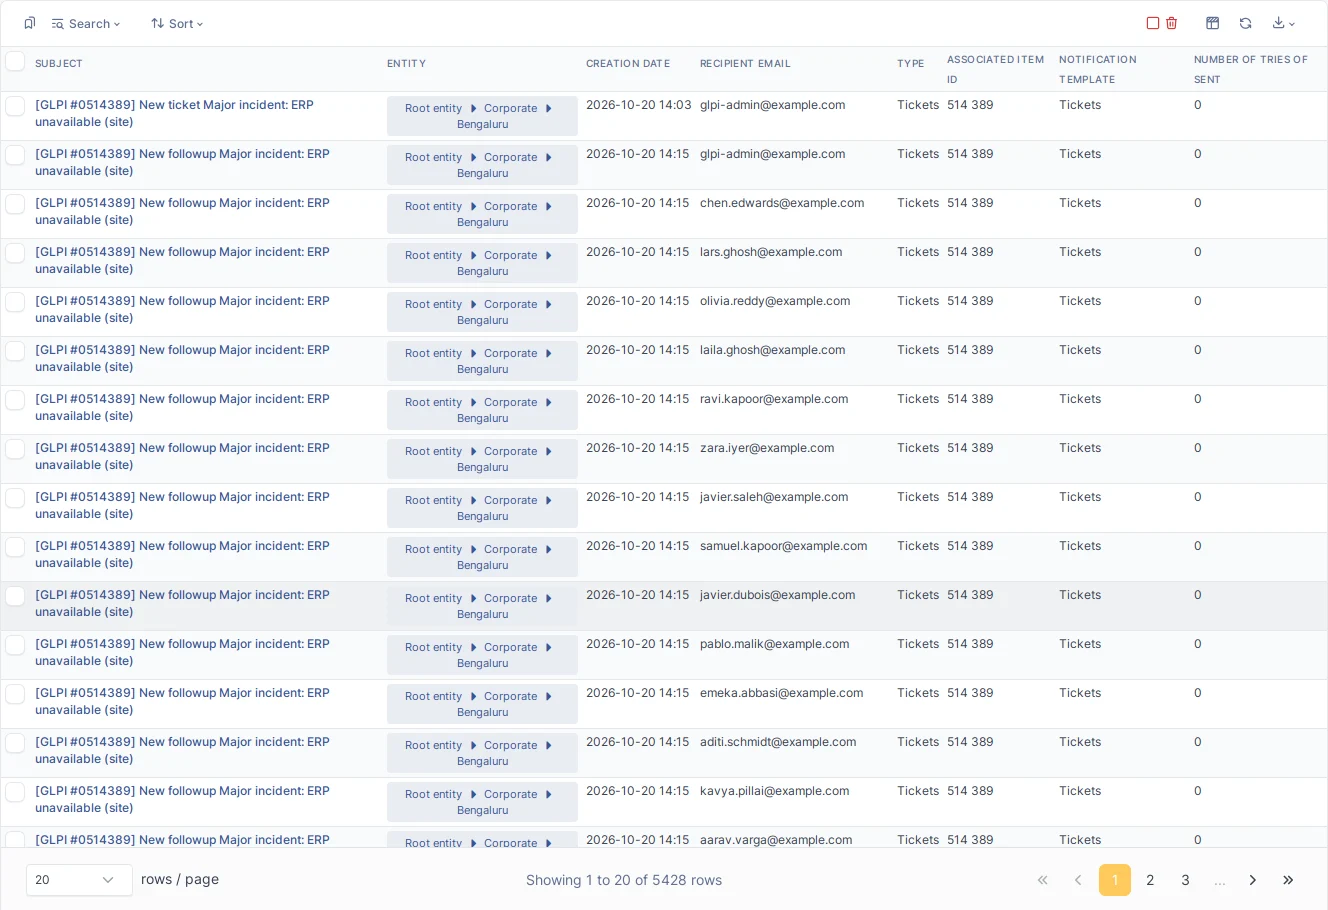
One more detail decides who hears about an incident at all. GLPI only notifies users who have a profile in the ticket’s entity, or a recursive profile above it. This is a deliberate access check, but nothing warns about it. When we logged the incident in the root entity, its 100 observers, who only had profiles in their sites, received nothing. A major incident logged above the sites it affects can silently skip the people watching it.
A task that stops
We also found a failure that needs no load at all. If the database restarts or crashes while the notification task is running, the task stays marked as running. GLPI never starts it again, and all outgoing email stops. We reproduced it on an idle server: three minutes after the restart the task was still marked as running and 2,943 notifications were waiting. GLPI’s own watcher task raises an alert in that case, but the alert is an email, and it joins the same stuck queue. We reported this to the GLPI project.
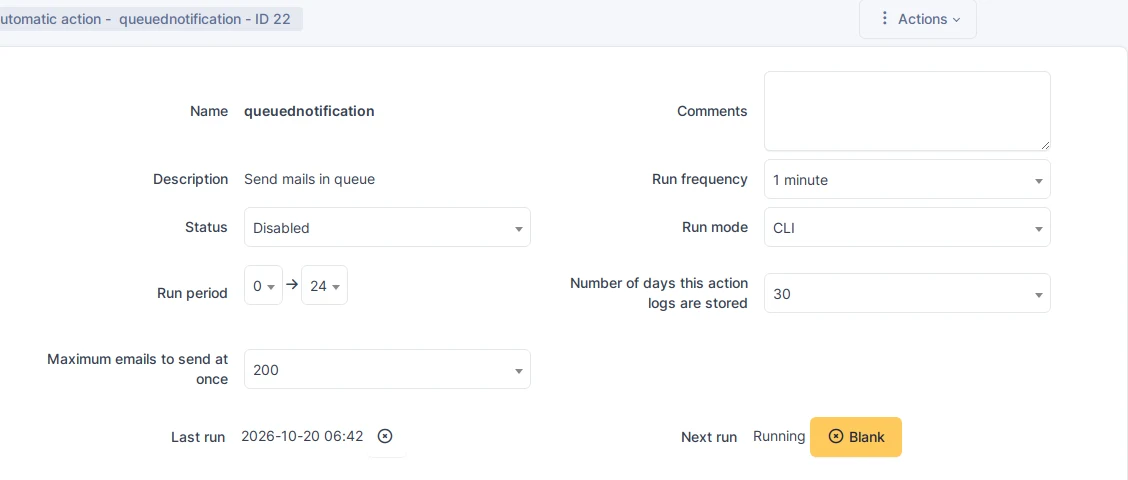
On this screen the status field shows “Disabled” while the task is marked as running, which makes the problem easy to miss. The Blank button next to “Running” resets it. Do not click Save on that screen: in our test it saved the task as disabled, and the console command below then no longer found it. GLPI also has a console command that resets tasks marked as running, by default those running for more than 30 minutes. A shorter delay suits the notification task: php bin/console task:unlock --task QueuedNotification::queuednotification --delay 600, run every 5 minutes, resets it within 15 minutes. Keep the default for the mail collector, whose runs legitimately took 3 to 7 minutes during our incident test. Because GLPI’s own alert goes through the stuck queue, also alert from outside GLPI on the age of the oldest unsent notification (create_time in glpi_queuednotifications).
Form submissions under load
When a GLPI 11 form created a ticket, GLPI also updated the form record itself inside the same database transaction, so every submission of the same form waited for the one before it. Under heavy load the waits passed the database timeout: with memory sized to the data, 242 submissions failed at 75 and 100 technicians, each with an error page for the user.
We traced the cause and contributed a fix to GLPI. It was merged into GLPI 11.0 on 20 October 2026 and ships with the next 11.0 maintenance release. With it, none of the 8,003 form submissions in our tuned runs failed. Those runs also used the tuned configuration and a newer version, so the 242 to 0 comparison is not an isolated test of the fix; the cause itself is shown in the code and by the test that comes with the fix. With a single user the fix makes no measurable difference: at 500,000 tickets a form submission took 2.26 seconds without it and 2.25 with it.
Under the same concurrency, answers to the same form sometimes received the same answer number, which is shown in the ticket list’s answers column. Every answer and its ticket were saved; only the number repeats.
Questions administrators ask
Does Redis make GLPI faster?
Not as a cache, on a single server. Yearly statistics took 4.2 seconds and the ticket list 1.1 seconds with the default file cache and with Redis alike. A shared cache matters more when several web servers serve the same GLPI, which we did not test.
Redis sessions change one thing: session locking. PHP locks a user’s session while a request runs, so a user’s second request waits for the first. Pages such as statistics hold the session for their whole run; since GLPI 11.0.9, dashboard cards release it early. To measure it, one user started yearly statistics in one tab and opened the ticket list in a second tab one second later.
With file sessions the ticket list waited until the statistics finished. Redis sessions, set up safely, wait in the same way and took the same time. With locking on and the phpredis default settings, a request gives up waiting after two seconds (100 retries of 20 milliseconds). In the phpredis version we used (6.3), the session then fails to start: every ticket list in tab 2 ended on an error page after 2.6 seconds. Older phpredis versions continued with a read-only session instead, which loses whatever the request writes to it. Setting redis.session.lock_retries = -1 makes the request wait for the lock, as in the second bar. Redis can also run with locking switched off, but GLPI keeps its form security tokens in the session, and two requests from the same user can then overwrite each other’s tokens. We do not recommend it. The lasting fix is making the slow pages faster. Session files on shared network storage, used in some clustered setups, make every lock slower; keep sessions on local disk or in Redis.
Source: MarifeX measurements on one GLPI server, 4 vCPU and 16 GB RAM.
How large does the history get?
At 500,000 tickets the history table held 11.7 million rows (2 GB), about 23 rows per ticket, 56% of them about tickets. GLPI’s default purge settings remove inventory and software history after 3 to 12 months, but keep the creation, changes and deletion of tickets forever.
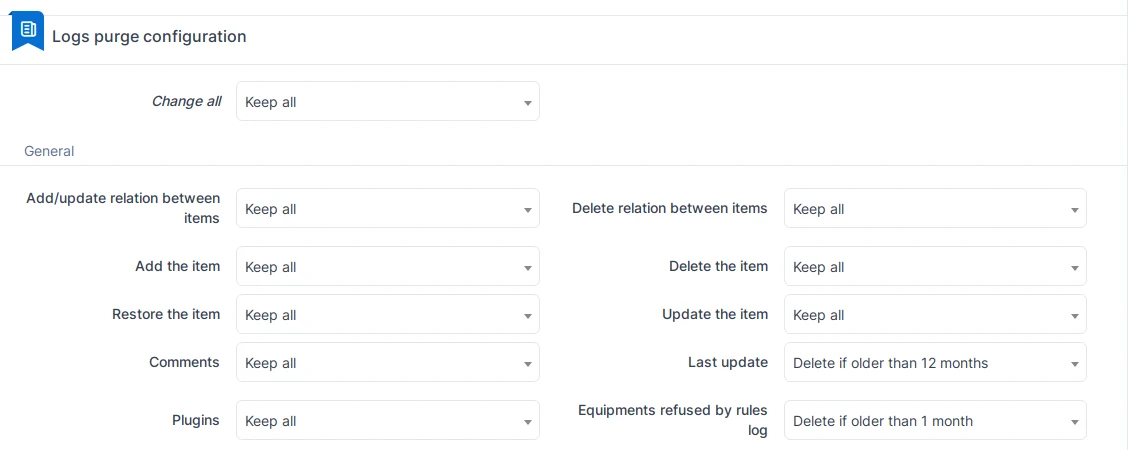
The history tab of a single ticket stayed fast (1.9 seconds at 500,000 tickets, in line with the ticket page itself). The cost is size, backups and maintenance. Purging everything older than two years removed 2.4 million rows in 58 seconds on our server.
Do many entities slow GLPI down?
The time followed the amount of data in scope. The same technician ran the same screens with all 49 entities in scope, then inside one large site and one small site. This changed the number of entities and the data in scope together, so it does not show the effect of the entity count on its own, and we did not test more than 49 entities.
- All 49 entities
- One large site, 24,000 tickets
- One small site, 500 tickets
All tickets by date
Global search
Yearly statistics
Source: MarifeX measurements on one GLPI server, 4 vCPU and 16 GB RAM.
Technicians who work for one site but are given the whole tree pay for it on every wide search, and so does everyone else on the server, because those searches are where the CPU goes.
How long do backup, restore and upgrade take?
On an idle server the database, compressed with gzip at its fastest level on the same server, came to 441 MB and dumped in a minute; restoring it took nine. During working hours with 25 technicians, the same dump took almost seven minutes, and while it ran screens were about 40% slower. Compression takes a full core of a 4 vCPU server; compressing on another machine leaves it to users. A minor upgrade of the database took 3 seconds; most of an upgrade window is the backup before it.
Source: MarifeX measurements on one GLPI server, 4 vCPU and 16 GB RAM.
Is GLPI slow after a database restart?
Not after a planned restart. MariaDB saves the list of pages it holds in memory when it shuts down and reloads it when it starts, which took 6 seconds here, and screens were as fast as before from the first click.
After a crash-like cold start, with nothing to reload and the operating system’s file cache empty, only the first visit to each screen was slow: text search took 5.6 seconds instead of 1.7 and global search 10 instead of 6.9. From the second visit, about half a minute after the start, everything was back to normal. We measured this with one user; with many users the first minutes would be slower.
Does a computer with thousands of tickets slow down linking?
No. We linked new tickets to one computer that already had none, 1,000, 5,000 and 20,000 linked tickets, a quarter of them with ticket costs, so that the computer’s cost total was recalculated on every link. Linking took 0.17 to 0.19 seconds at every stage, and about one second with 20 links at once while the computer’s inventory agent reported at the same time.
How much storage per 100,000 tickets?
About 1.1 GB of database, history included, and about 9 GB of attachments, growing in a straight line with tickets. Attachments are easiest to estimate from your own figures:
attachments ≈ tickets × share of tickets with files × files per ticket × average file size
In our data 22.5% of tickets carried files on the ticket or its follow-ups, 1.37 files each, averaging 297 KB (median 145 KB). Photos were a quarter of the files but two thirds of the space.
The tables that everyday screens use most are much smaller than the whole database. At 500,000 tickets: tickets 984 MB, follow-ups 545 MB, form answers 259 MB, solutions 130 MB, tasks 100 MB and ticket actors 94 MB, against 2 GB of history.
Sizing before you grow
Most of what we measured can be planned from a few figures that every service desk already has or can collect in an afternoon. Run our read-only calibration queries on a copy of your database to compare it with our datasets, then use the table below.
| Collect | It decides | What we measured |
|---|---|---|
| Tickets per year and how many years you keep | Database size and memory | About 1.1 GB of database per 100,000 tickets; size the buffer pool to the database |
| Share of tickets with files, files per ticket, average size | Attachment storage, backup time | About 9 GB per 100,000 tickets at 22.5%, 1.37 files and 297 KB |
| Screens opened per minute in the busiest hour, by all users | CPU | About 1.2 CPU seconds per screen at 500,000 tickets; one 4 vCPU server ran out of CPU between 10 and 25 technicians |
| Entities each technician sees | CPU per wide search | All 49 entities in scope made wide searches 2 to 7 times slower than one site |
| Emails per hour, normally and in an incident | Collector schedule and batch | Default intake is 60 an hour; a burst of 300 held the scheduler 3 to 7 minutes per run |
| Observers on a major incident and how often you update it | Notification queue | About one email per observer for every public update |
| Your backup window | When backups run | Database dump 1 minute idle, 7 minutes under load |
Estimating CPU. At 500,000 tickets each screen cost about 1.2 CPU seconds, at 10 technicians and at 25 alike. The figure includes the background work of our day (mail intake, notifications, the API integration, inventory agents and reporting queries) and our screen mix, in which about 18% of technician screens were wide searches. A rough estimate for your own server:
vCPUs ≈ screens per minute in the busiest hour × 1.2 ÷ 60 ÷ 0.7
The 0.7 keeps the server at 70% busy. For example, 150 screens a minute gives about 4.3 vCPUs. Count screens as pages opened by technicians and self-service users, not as lines in the web server log: each screen in our test made about six requests. More wide searches or more data per screen raise the cost per screen.
Two of these change with time. History grows every year unless you purge it, and wide-scope technicians become more expensive as the ticket count grows. Settle retention and entity scope early, while they are easy to change.
What we recommend
- 1
Size the database memory to the data
Set the InnoDB buffer pool close to the size of the GLPI database, leaving room for PHP. At 500,000 tickets this alone took ticket opening from 6.4 to 1.0 seconds.
- 2
Align web and database limits
Allow more database connections than Apache workers, so the web server cannot exhaust the database. We used 300 connections for 150 workers.
- 3
Choose the worker limit by what must not wait
Below saturation it makes no difference. Past it, a high limit favours users and a lower one keeps notifications and email on time. Neither adds capacity.
- 4
Fix email intake before it is needed
Collect every minute from cron, and use an administrator address that is not the collector mailbox. A batch of 50 cleared our normal email; in a storm, a smaller batch keeps notifications moving.
- 5
Keep the notification task running
Run php bin/console task:unlock --task QueuedNotification::queuednotification --delay 600 every 5 minutes, and alert from outside GLPI when the oldest unsent notification is more than a few minutes old.
- 6
Plan for major incidents
Log incidents in an entity where the affected users have a profile, or in a parent entity where they have a recursive profile, and remember that every public update sends one email per observer. Watch the queue during the incident.
- 7
Scope technicians to their entities
Give each technician the sites they serve. Wide scopes made lists, search and statistics two to seven times slower.
- 8
Keep heavy work out of peak hours
Backups, large exports and reporting queries compete with users for the same CPU. A dump that takes one minute at night took seven during the day.
- 9
Decide how long to keep history
Set a retention period for ticket history and purge regularly, before the table reaches tens of millions of rows.
- 10
Plan CPU for your busiest hour
Once memory is right, CPU sets the limit. Convert our figures with your own technicians and pace, and plan above your busiest hour.
- 11
Use Redis for the right reason
On a single server it did not speed up GLPI as a cache or for sessions. If you use Redis sessions, keep locking on and set redis.session.lock_retries = -1; with the default, a request that waits more than two seconds for its session fails.
Under the hood
Which limit you hit first
In our measurements the first limits were database memory and background queues, not CPU. Both are configuration.
One GLPI server under a growing service desk, verified on GLPI 11.0 with MariaDB 10.11, October 2026.
In the order we hit them
- 1Does the database fit in the buffer pool?Yes
NoEvery request waits on disk. Size the buffer pool to the data first; nothing else helps as much.
- 2Do email intake and notifications keep up, including during an incident?Yes
NoRaise the batch sizes, run them every minute from cron, keep GLPI from mailing its own mailbox, and schedule task:unlock.
- 3Is CPU below about 80% in the busiest hour?Yes
NoNarrow technician scope, keep wide searches, statistics and backups out of peak hours, then add CPU.
Configuration and checks
The tuned configuration in this study, on 4 vCPU and 16 GB RAM with 500,000 tickets:
- MariaDB:
innodb_buffer_pool_size = 8G,tmp_table_size = 64M,max_heap_table_size = 64M,max_connections = 300. - Apache with PHP: prefork with 150 workers (48 and 24 in the worker comparison),
memory_limit = 256M, OPcache on. With 150 workers the server never swapped: at least 9.6 GB of the 16 GB stayed available, even at 100 technicians. The database was about 5 GB, so the 8 GB buffer pool never filled; with a larger database, plan for the full 8 GB plus PHP. - GLPI: scheduled tasks in CLI mode, run every minute; mail collector every minute with 50 emails per run; queued notifications 200 per run; administrator address separate from the collector mailbox.
Everything else was left at its default.
Screen mix. Each technician round opened the home page, the list of open tickets and a recent ticket, then three more screens drawn at random: adding a follow-up (21% of the draws), text search (18%), the history tab, all tickets by date, an old ticket, a computer’s tickets and the knowledge base (11% each), global search (6%) and yearly statistics (1%). About 18% of technician screens were searches or lists across all tickets in scope. Self-service users opened their home page, the service catalogue, a form and their tickets.
GLPI 11.0.8 and 11.0.11. Median time in seconds at 500,000 tickets, tuned configuration, one run on 11.0.8 and three on 11.0.11. At 10 technicians, with the CPU 42% busy, opening a ticket measured the same, but every 11.0.11 run was slower on saves: 10 to 20% on follow-ups and 16 to 27% on form submissions. One 11.0.11 run had MariaDB’s performance monitoring switched off, as in the 11.0.8 run, and was as slow as the others, so monitoring does not explain it. With a single 11.0.8 run we could not isolate the cause. At 25 technicians the CPU was 96 to 99% busy and repeated runs of the same configuration already differed by up to 40%, so the larger gap there cannot be separated from that variation.
| Technicians | Version | Open a ticket | Add a follow-up | Submit a form |
|---|---|---|---|---|
| 10 | 11.0.8 | 1.17 | 2.81 | 1.18 |
| 10 | 11.0.11 (three runs) | 1.09 to 1.19 | 3.09 to 3.36 | 1.37 to 1.50 |
| 25 | 11.0.8 | 2.86 | 8.18 | 3.58 |
| 25 | 11.0.11 (three runs) | 3.19 to 4.53 | 10.62 to 13.50 | 6.08 to 7.24 |
Reconciliation. For every tuned run we compared what the load generator reported, what the web server answered and what the database stored. Every save the server answered has exactly one row in the database. The load generator counts slightly fewer because it stops waiting for requests still running when a run ends.
| Run | Form submissions: generator / server / database | Follow-ups: generator / server / database |
|---|---|---|
| 150 workers | 1,863 / 1,896 / 1,896 | 214 / 218 / 218 |
| 150 workers, repeat | 1,825 / 1,866 / 1,866 | 222 / 224 / 224 |
| 48 workers | 1,052 / 1,056 / 1,056 | 265 / 267 / 267 |
| 24 workers | 841 / 841 / 841 | 246 / 246 / 246 |
| Major incident with backup | 1,247 / 1,249 / 1,249 | 282 / 282 / 282 |
| Major incident, site entity | 742 / 743 / 743 | 215 / 216 / 216 |
| 150 workers, monitoring off | 349 / 352 / 352 | 85 / 86 / 86 |