

Alert fatigue is rarely a people problem. It is a configuration problem. When a single outage produces dozens of notifications, or the same problem opens and closes all night, people learn to ignore alerts, and the one that matters gets missed.
Zabbix has the tools to fix this. These are the six we reach for first.
1. Trigger dependencies
When a core switch or an uplink fails, every host behind it becomes unreachable, and each one raises its own problem. The real cause is buried in the noise.
A trigger dependency tells Zabbix that one problem only makes sense if another is not already active. Make the host availability triggers depend on the switch or uplink they sit behind, and an outage raises one problem: the switch. Model dependencies along the real network path, not the way hosts happen to be grouped.

2. Separate problem and recovery conditions
A value hovering around a threshold makes a trigger flap: problem, resolved, problem again, many times an hour.
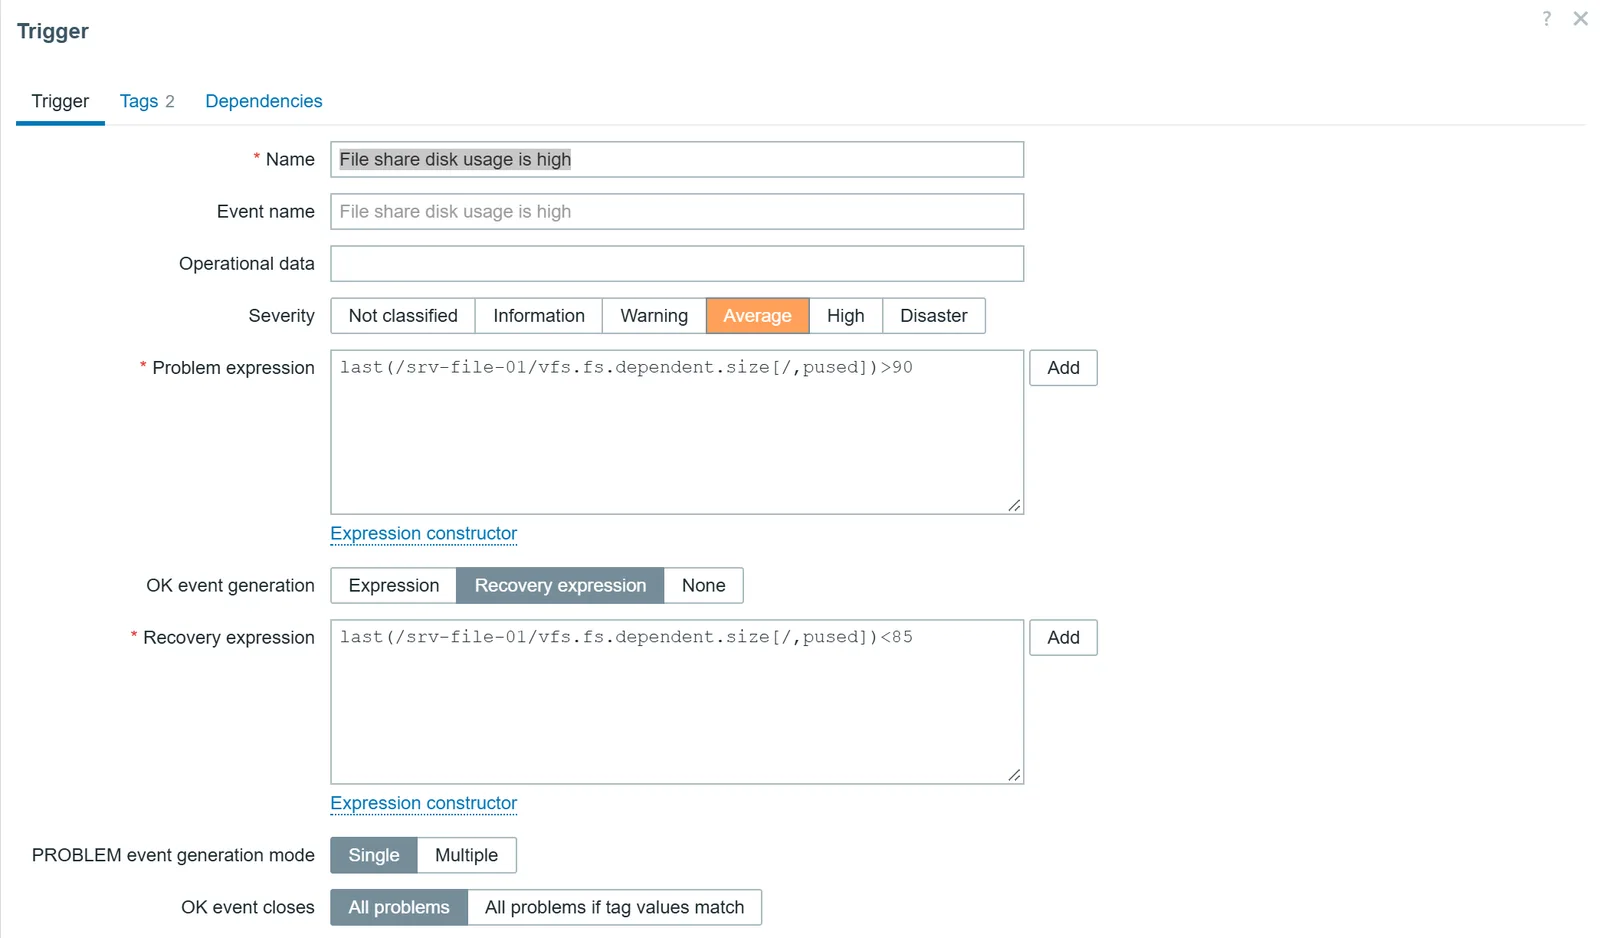
Give the trigger a recovery expression that is different from the problem expression. For example, raise the problem when disk usage goes above 90% and only resolve it when it drops below 85%. The gap between the two is what stops the flapping.
3. Alert on sustained values, not single samples
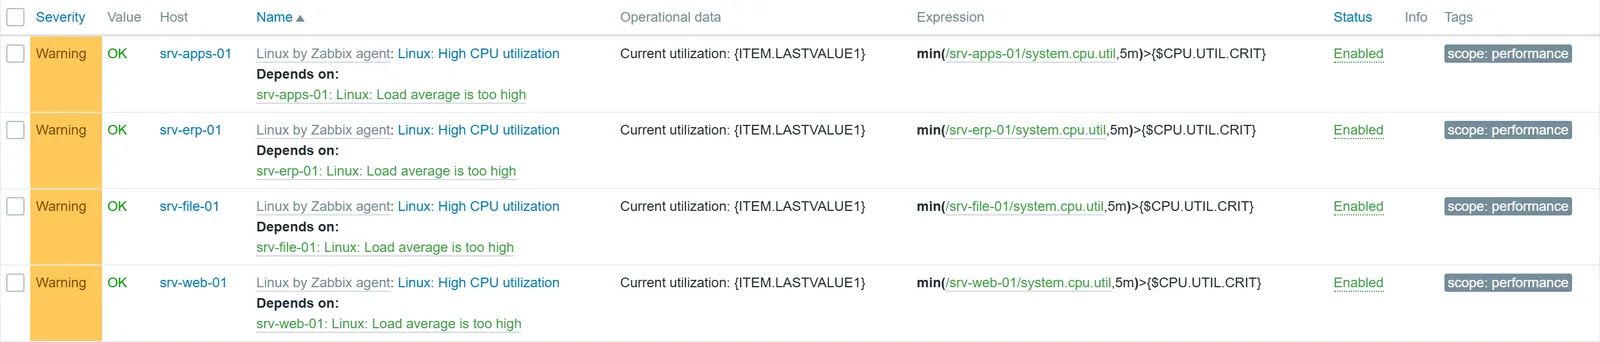
A single high reading is often just a moment. Trigger functions that look at a period of time, such as the minimum or average over the last five minutes, only fire when the condition has held.
min(/server/system.cpu.util,5m)>90 means “above 90% for five minutes”, which is usually what you meant in the first place.
4. Maintenance periods
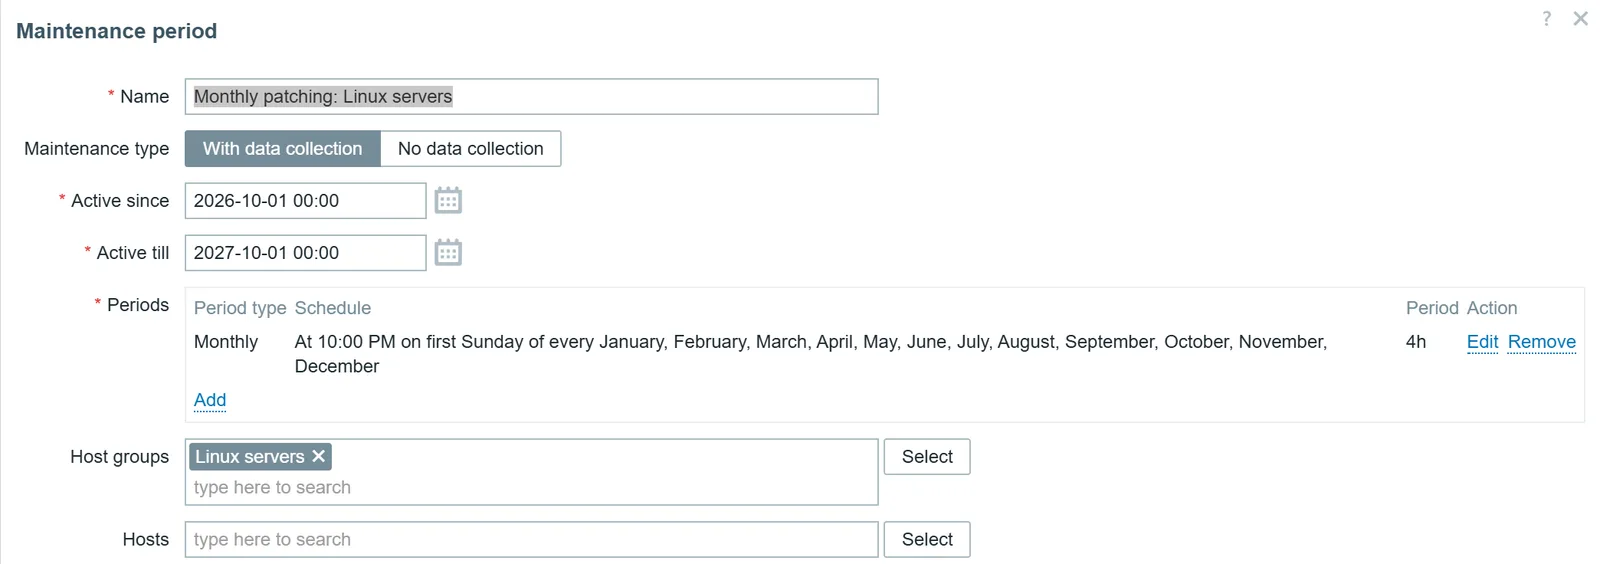
Planned work should not page anyone. Maintenance periods tell Zabbix that hosts are being worked on, for a fixed time or on a schedule, either still collecting data or not. Put patch windows and planned reboots into maintenance, and the alerts that do arrive during those hours mean something.
5. Tags and tag-based actions
Tag triggers with the service, the team and the environment they belong to. Actions can then route notifications by tag, so the database team hears about database problems and production alerts are handled differently from test ones.
Tags also make problem views, dashboards and reports far easier to filter.

6. Event correlation
Some problems are only symptoms of another one, or newer versions of a problem that is already open. Global event correlation matches events by their tags and can close the new problem, or the old one, automatically. It is the tool for patterns that dependencies alone cannot describe.

Then measure
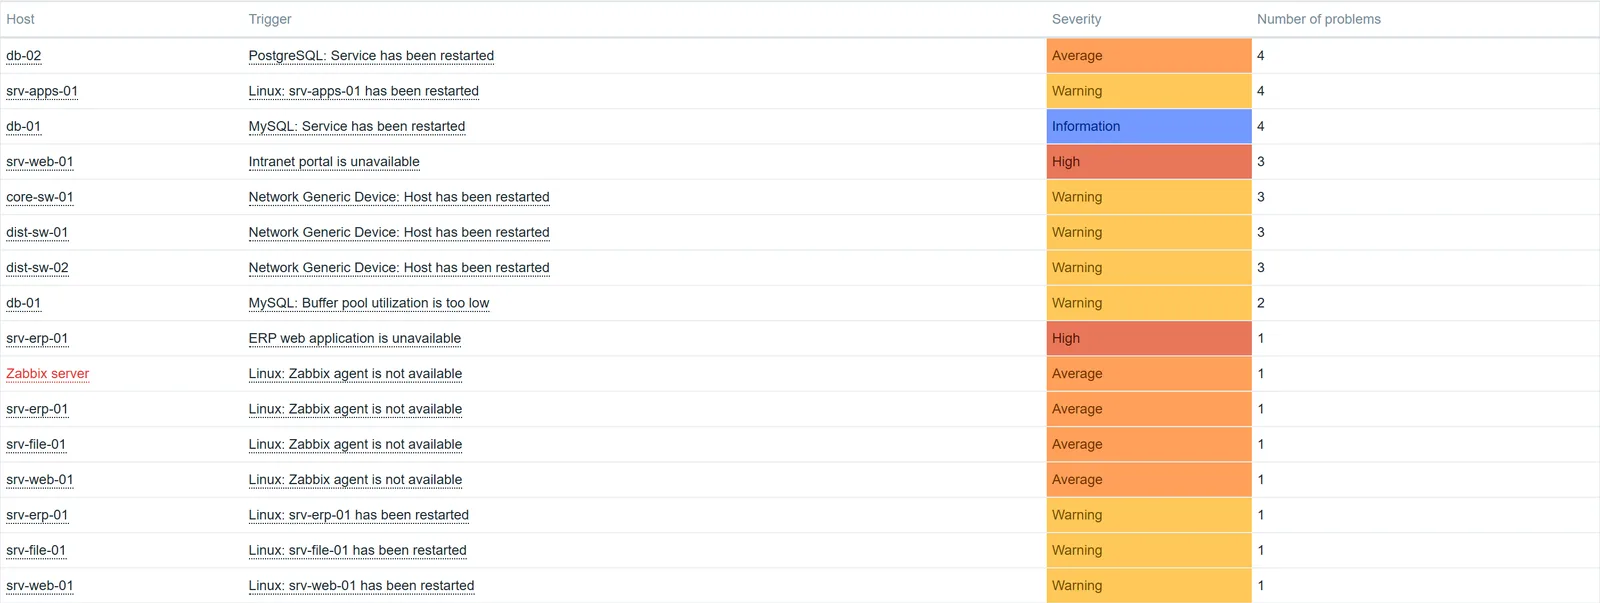
Noise comes back if nobody looks. Zabbix’s report of the most frequently triggered problems is the best place to start: review it every month, and fix or retire the triggers at the top. A small number of triggers usually causes most of the noise.
Where GLPI fits
Once alerts are few and accurate, they are worth turning into tickets. Zabbix includes an official GLPI webhook that opens a ticket for each real problem, adds follow-ups as it changes and marks it solved on recovery, so every problem has an owner and an SLA.
If your Zabbix has become too noisy to trust, we can review it with you and bring the alert volume down to what your team can act on.