

Metabase makes it easy to put a chart on top of any database. That is exactly the risk with GLPI: the first dashboard looks right, the numbers do not match what the service desk sees, and trust in reporting is gone before it starts.
GLPI stores its data in a way that suits running a service desk. Reporting on it well means knowing a few of its habits.
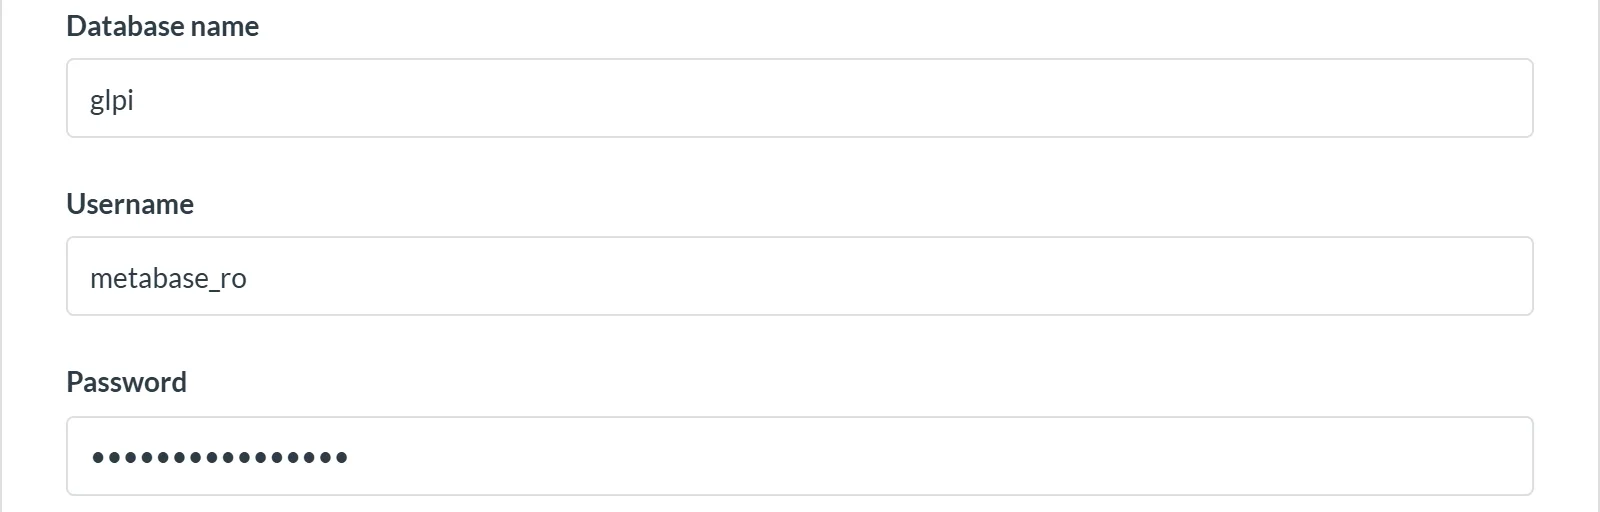
1. Start from a read-only copy
Point Metabase at a database replica or a reporting copy, using a database user that can only read. A heavy question run against production at ten in the morning slows GLPI down for everyone.
A reporting copy also gives you room for reporting-only views in a separate schema, without touching the database GLPI depends on.
2. Count each ticket once
In GLPI, the people involved in a ticket live in a separate table from the ticket itself, with a type that says whether each person is the requester, an assigned technician or an observer. Groups are linked the same way, in a table of their own.
Join tickets to those tables the obvious way and a ticket with two assigned technicians appears twice. Totals go up and averages go wrong.
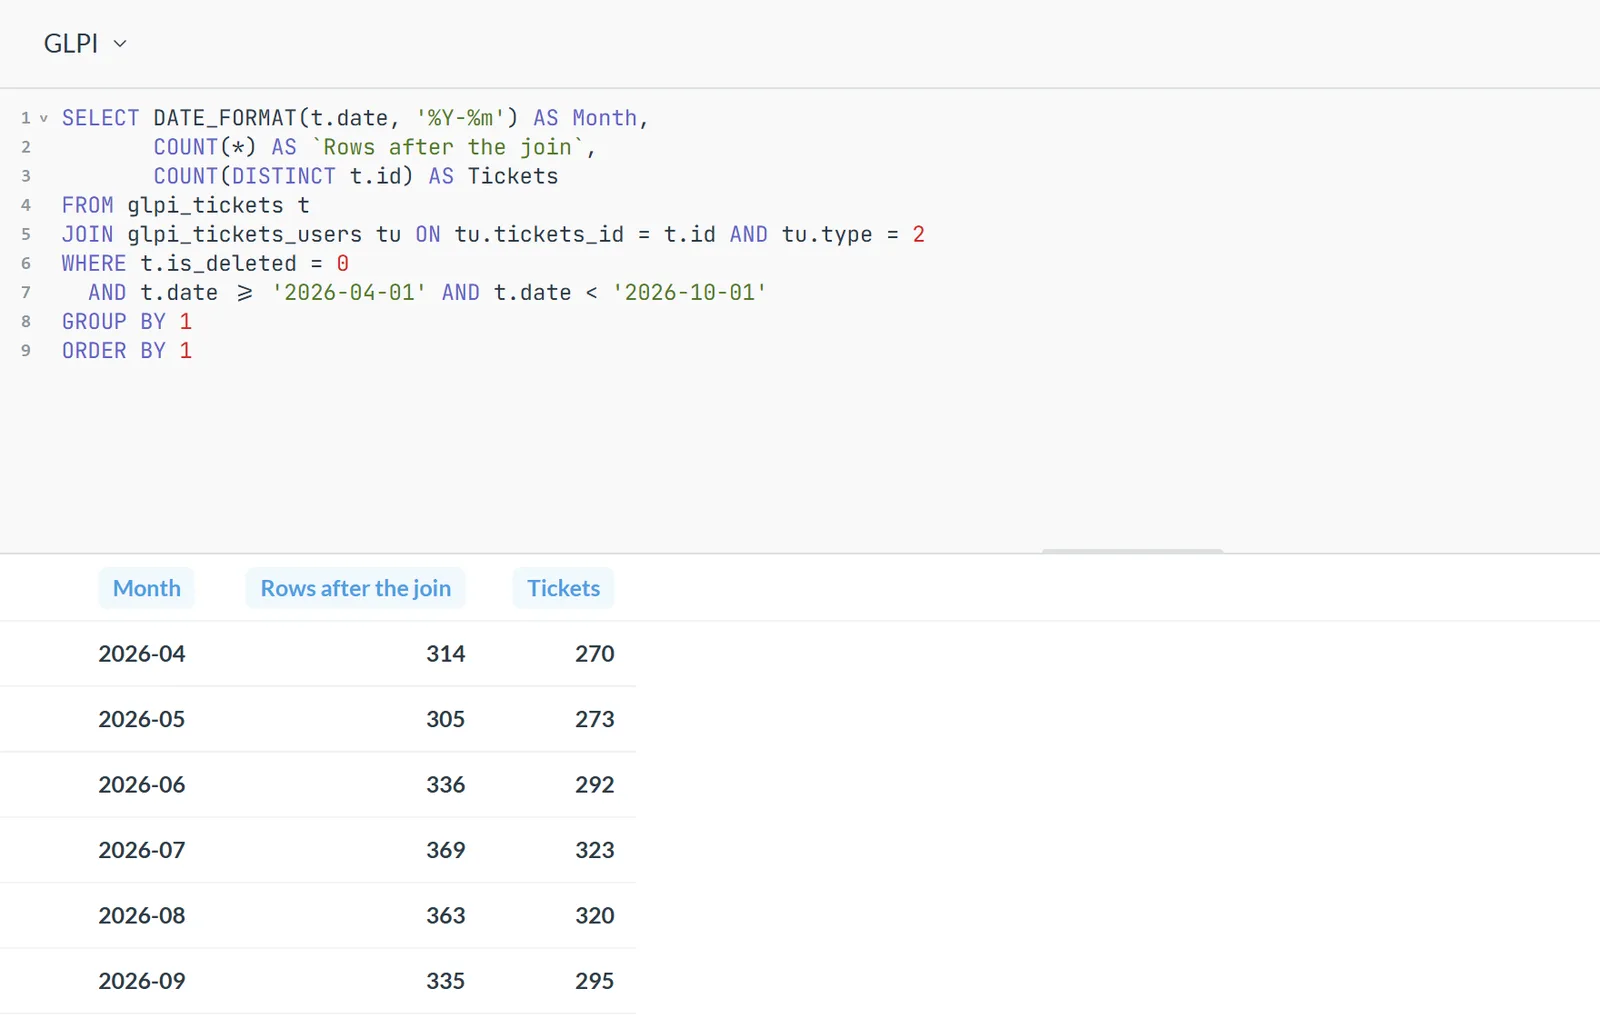
Decide what each question is about. If it is about tickets, count distinct tickets. If it is about workload, attribute each ticket deliberately, for example to every assigned technician or only to the first. Then build that rule into a Metabase model once, so nobody has to remember it.
3. Turn codes into words
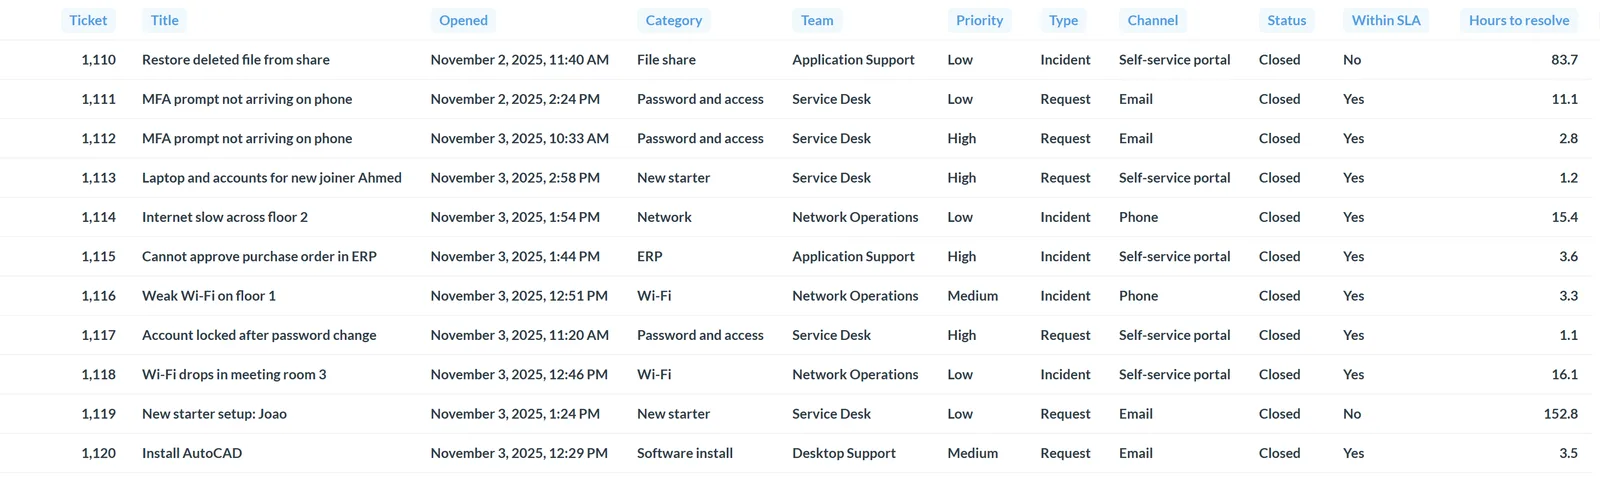
GLPI stores status, urgency, impact and priority as numbers. Status runs from 1 for New to 6 for Closed: 2 and 3 are the two Processing states (assigned and planned), 4 is Pending and 5 is Solved. Urgency, impact and priority run from 1 for very low to 5 for very high, and priority can also be 6 for major.
A chart that says “status 5” helps nobody. Map every code to the label your team sees in GLPI, in one model, and use that model everywhere.
4. Respect the trash and the entity tree
Tickets and assets moved to GLPI’s trash are still in their tables, with a deleted flag set. Leave them in and totals drift away from what people see in GLPI. Asset tables also hold templates, flagged separately, which belong out of every count.
Entities nest inside each other. Each entity records its parent, and its full name shows the whole path, for example “Root entity > Europe > Paris”. A manager for a region expects to see the region and everything below it, so filters should follow the tree rather than a single entity.
5. Measure SLAs from the right fields
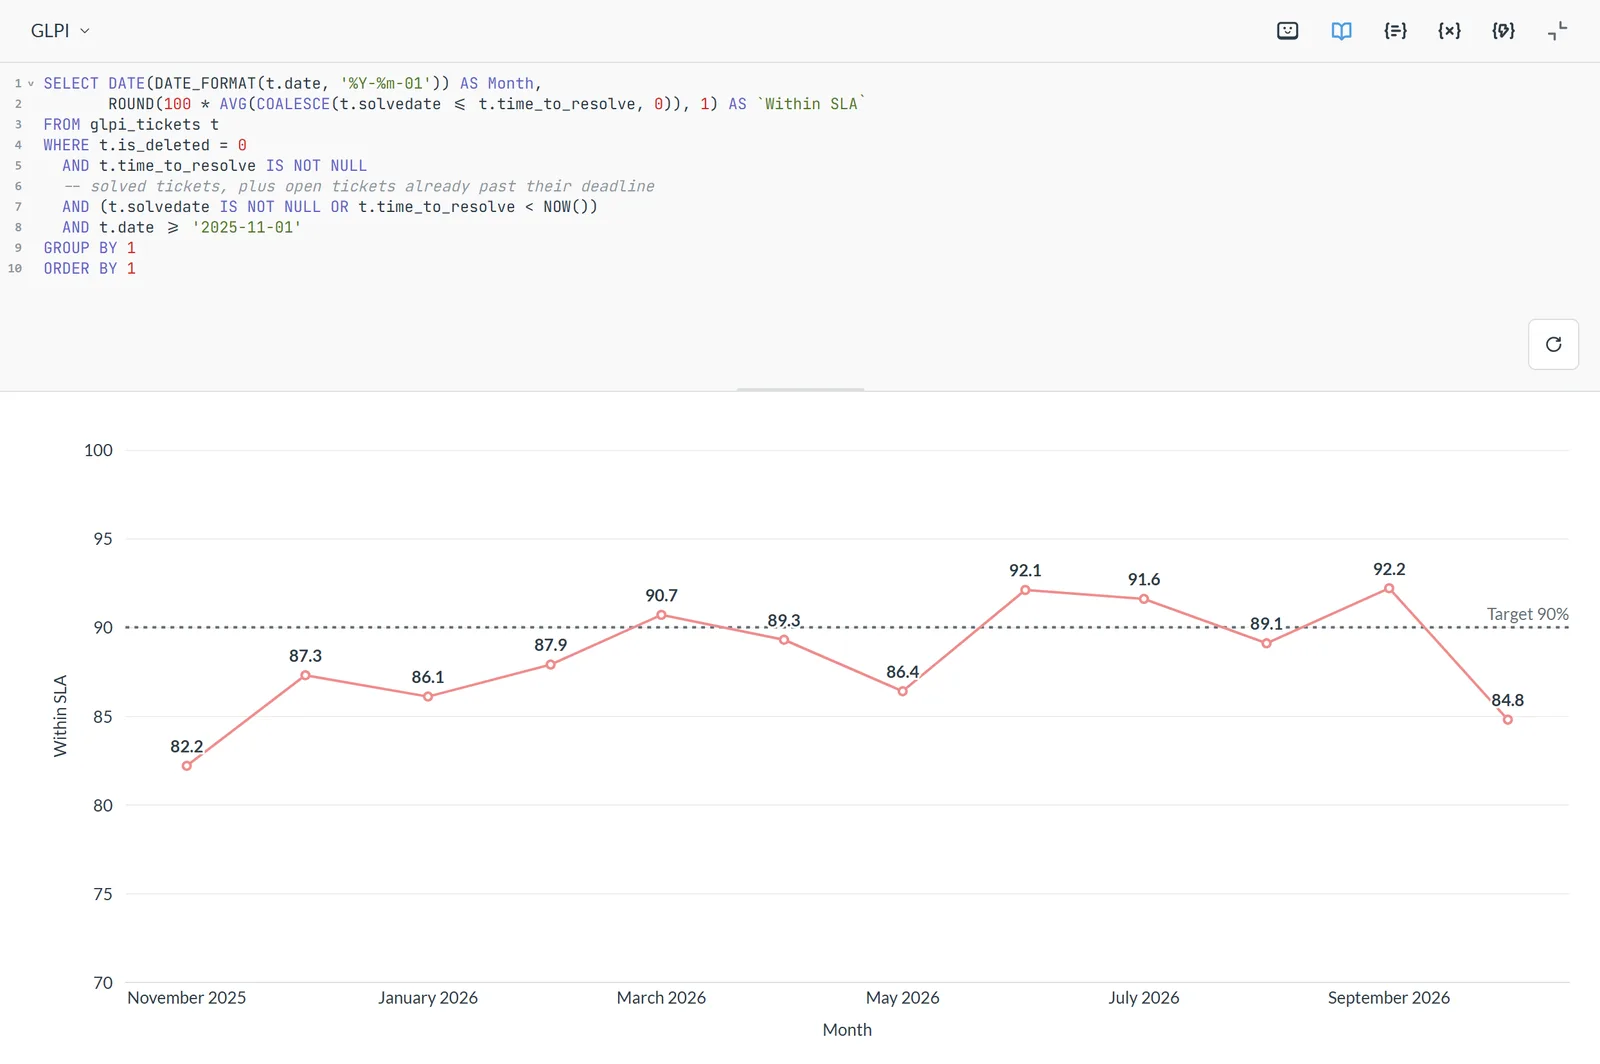
Each ticket carries its time-to-resolve deadline and the date it was solved. A ticket breached its SLA when it was solved after the deadline, or when it is still open and the deadline has passed. Counting only solved tickets hides the breaches that are still running.
Make it self-service
Once the models are right, the rest is the easy part. Build dashboards with the people who will read them, organise them into collections with permissions per team, and send them by email on a schedule to the managers who never log in.
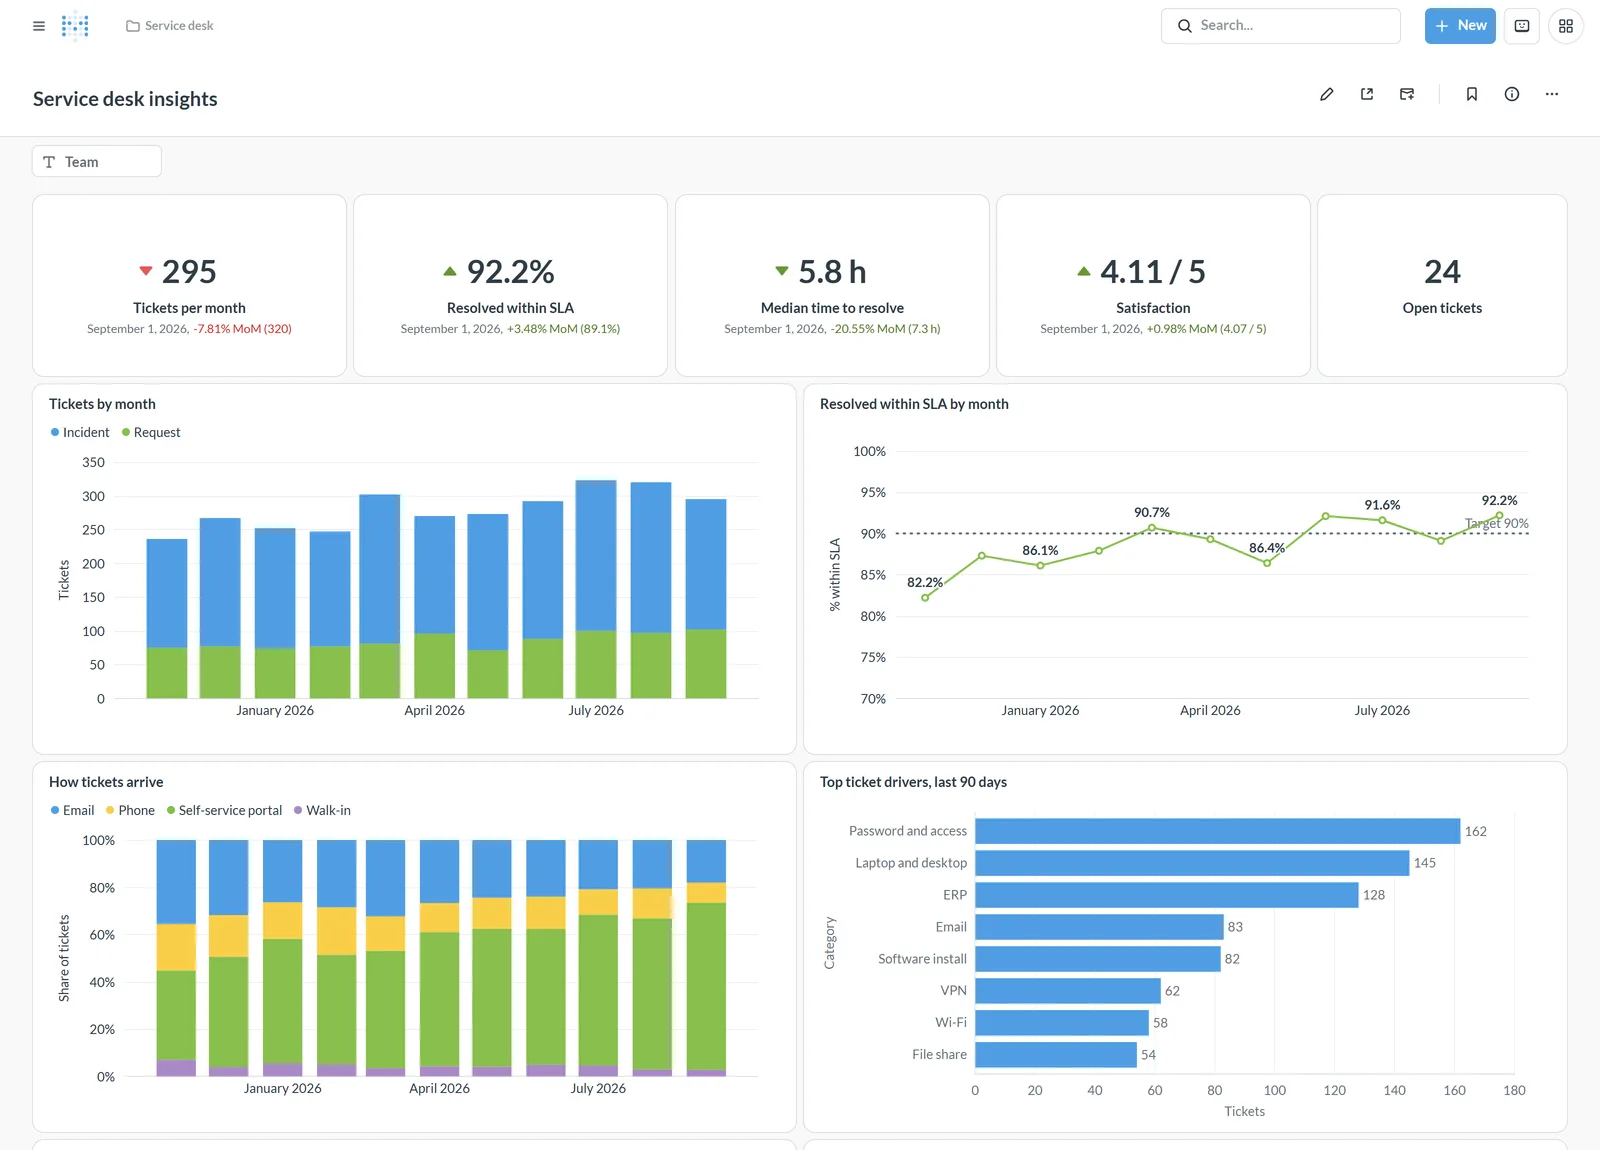
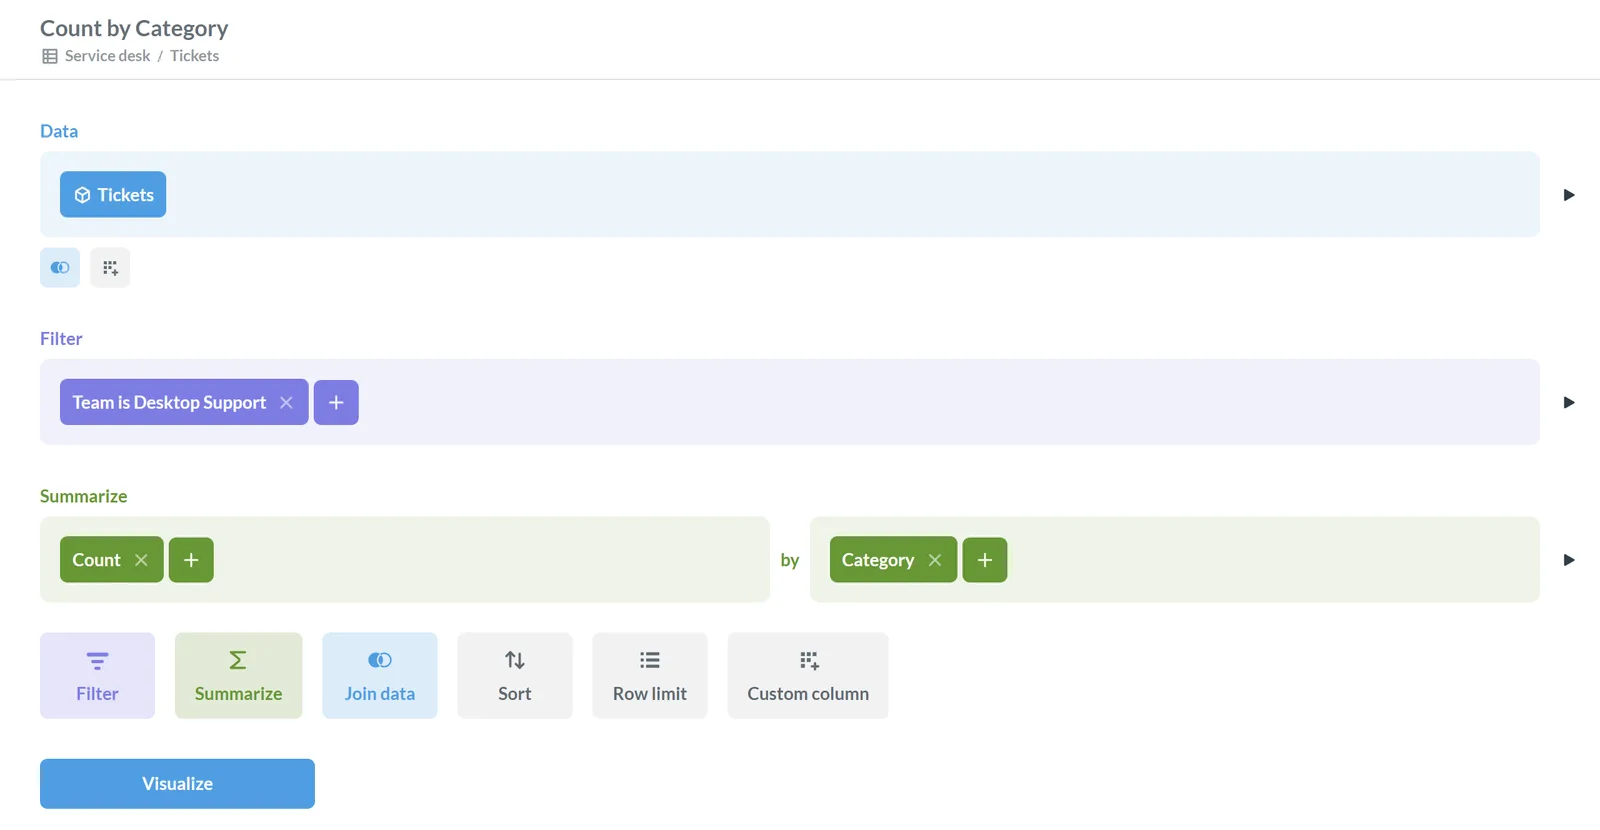
From there, your team can ask new questions with Metabase’s query builder without writing SQL, and get answers they can trust.
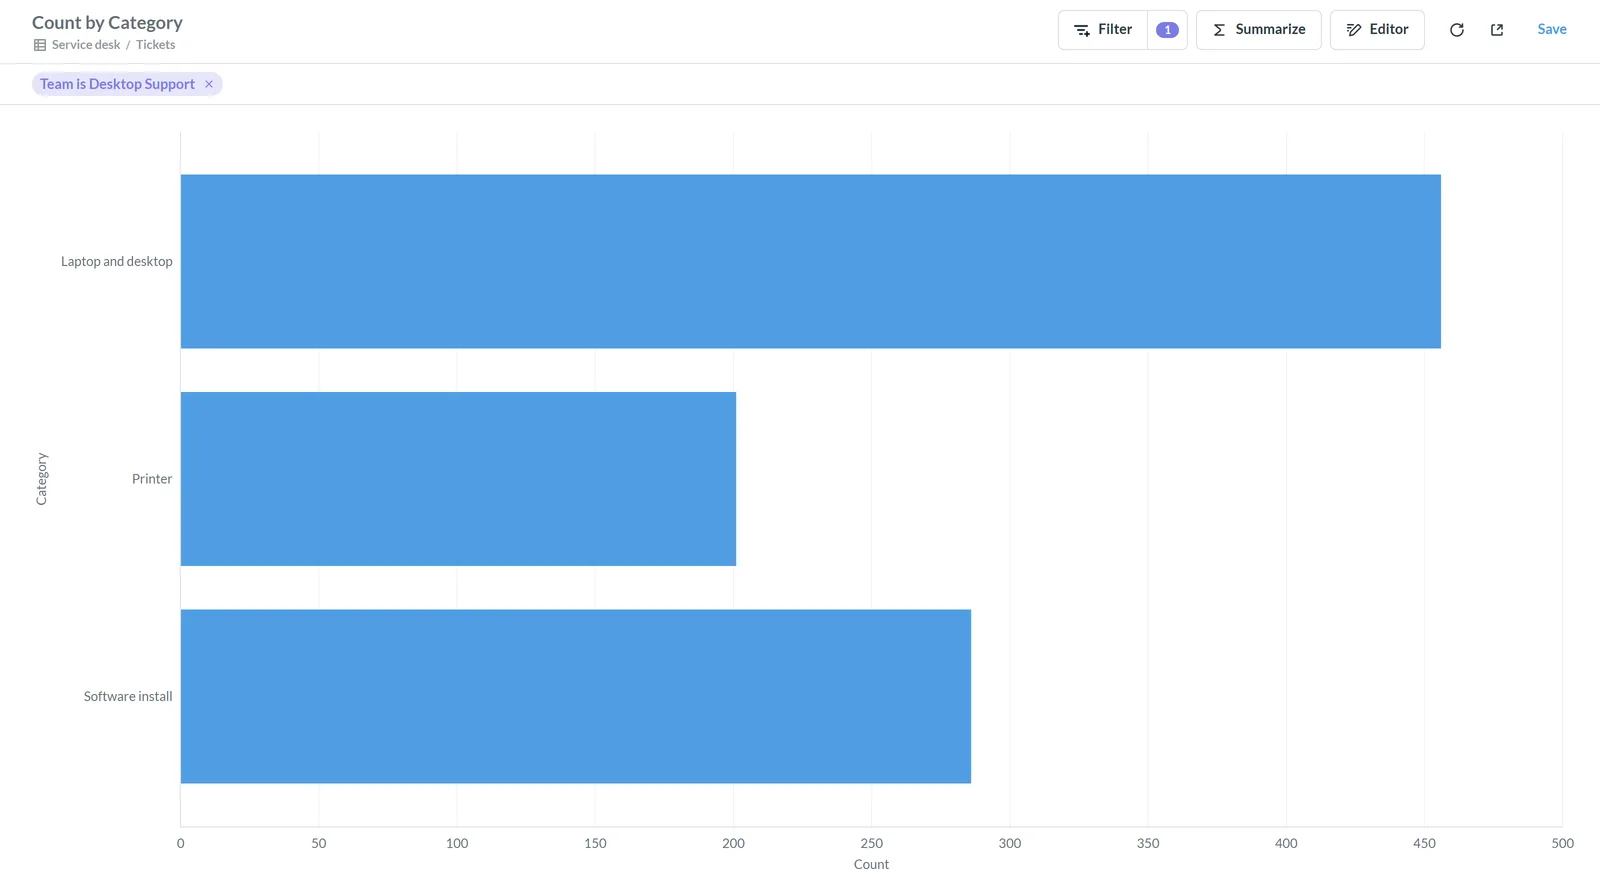
Metabase dashboards do not have to live in a separate tool. With the Metabase plugin for GLPI, they open on GLPI’s home page, and each GLPI profile sees only the dashboards it is allowed to. The same Metabase can also bring in data from Zabbix and other systems.
If you would rather keep all reporting within GLPI itself, MarifeX Analytics does that as a GLPI plugin. We can help you pick, or use both.